Global Commodity Technical Analysis Report

Bearish Momentum in Commodities Market Last Week, One Commodity above Support Level – US Cocoa

Jun 02, 2025

CCH5
Investment Type
Commodity
Risk Level
Action
Rec. Price (US$)

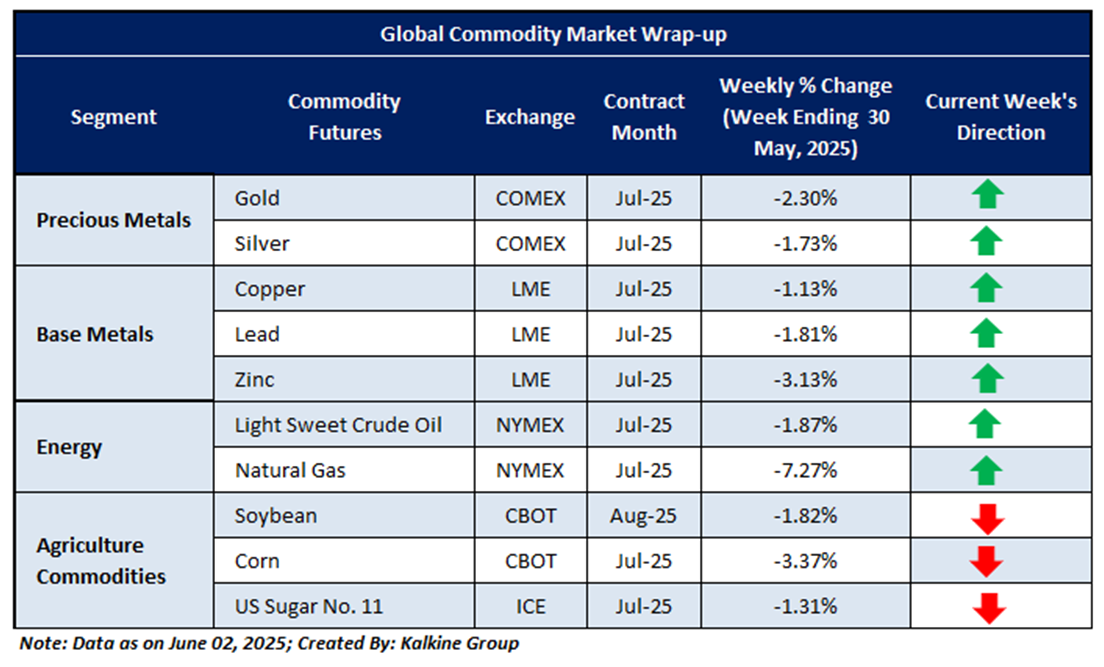
Global Commodity Market Wrap-Up

The metals market lost ground last week as investor concerns over global economic uncertainty dampened demand. Gold declined 2.30% and silver slipped 1.73%, while base metals also moved lower—copper fell 1.13%, zinc dropped 3.13%, and lead eased 1.81%. This broad-based weakness reflects a cautious sentiment, as markets remain on edge over geopolitical tensions and await key signals from central banks. The divergence in metal movements suggests a shift in market positioning, with investors balancing defensive strategies against a subdued industrial outlook in an uncertain global environment.

Last week, natural gas prices plunged 7.27%, pressured by fading seasonal demand despite ongoing supply concerns. Crude oil declined 1.87% amid market uncertainty and shifting investor sentiment. Meanwhile, U.S. sugar slipped 1.31%, diverging from the broader agricultural trend. These mixed movements reflect persistent supply-demand imbalances and heightened sensitivity to global economic instability. With volatility remaining elevated across energy and agricultural commodities, investors are advised to remain cautious and monitor key macroeconomic indicators along with commodity-specific developments that could influence short-term price dynamics.

Global commodity prices retreated from resistance levels last week, weighed down by ongoing macroeconomic and geopolitical uncertainties. Precious metals are trading near critical levels, hinting at a potential bearish reversal if sentiment firms or economic indicators shift. In energy, natural gas continues to fluctuate sharply within a broad range, while crude oil shows tentative signs of recovery from recent lows. Agricultural commodities are finding support, steadying amid sector-specific factors. This mix of resilience and volatility underscores a cautious market environment, with investors closely watching global developments to manage risk and seize potential opportunities in the dynamic commodities space.

The upcoming Micro and Macroeconomic events that may impact on market sentiments include an update ISM Manufacturing PMI, JOLTS Job Openings, ADP Nonfarm Employment Change Initial Jobless Claims and Nonfarm Payrolls.

Having understood the global commodities’ performance over the past week, taking cues from major global economic events, and based on technical analysis, noted below is the recommendation with generic insights, entry price, target prices, and stop-loss US Cocoa July Future (ICE: CCN5) for the next 2-4 weeks duration:

US Cocoa July Future (ICE: CCN5)

Price Action and Technical Indicator Analysis: July U.S. Cocoa futures are holding above a key support level, signaling sustained bullish momentum. A recent bullish engulfing candlestick pattern reinforces positive sentiment, while the 50-period Simple Moving Average provides reliable near-term support. The Relative Strength Index (RSI) at 52.78 suggests strengthening momentum as it trends above the neutral zone. The technical setup remains cautiously optimistic, with the moving averages offering a solid foundation for potential upside. A strong breakout above current levels could trigger further gains, while continued support above the SMAs may lead to consolidation before another upward movement. Overall, the trend leans bullish with growing momentum.

Now the next crucial resistance levels appear to be at USD 10500.00 and USD 10700.00, and prices may test these levels in the coming periods (2-4 weeks).

As per the above-mentioned price action and technical indicators analysis, US Cocoa July Future (ICE: CCN5) is looking technically well-placed for a ‘Buy’ rating. Investment decisions should be made depending on an individual’s appetite for downside potential, risks, and any previous holdings. This recommendation is purely based on technical analysis, and fundamental analysis has not been considered in this report. Technical summary of the ‘Buy’ recommendation is as follows:

Upcoming Major Global Economic Events

Market events occur on a day-to-day basis depending on the frequency of the data and generally include an update on employment, inflation, GDP, WASDE report, consumer sentiments, etc. Noted below are the upcoming week's major global economic events that could impact commodities’ prices:

Futures Contract Specifications

Disclaimers

Related Risks: Based on the technical analysis, the risks are defined as per risk-reward ratio (~0.80:1.00), however, returns are generated within a 2-4 weeks’ time frame. This may be looked at by Individuals with sufficient risk appetite looking for returns within short investment duration. The investment recommendations provided in this report are solely based on technical parameters, and the fundamental performance of the commodities has not been considered in the decision-making process. Other factors which could impact commodity prices include market risks, regulatory risks, interest rates risk, currency risks, and social and political instability risks etc.

Note 1: Past performance is not a reliable indicator of future performance.

Note 2: Individuals can consider exiting from the commodity if the Target Price mentioned as per the Technical Analysis has been achieved and subject to the factors discussed above.

Note 3: How to Read the Charts?

The Green colour line reflects the 21-period moving average while the red line indicates the 50- period moving average. SMA helps to identify existing price trend. If the prices are trading above the 21-period and 50-period moving average, then it shows prices are currently trading in a bullish trend.

The Black colour line in the chart’s lower segment reflects the Relative Strength Index (14-Period) which indicates price momentum and signals momentum in trend. A reading of 70 or above suggests overbought status while a reading of 30 or below suggests an oversold status.

The Blue colour bars in the chart’s lower segment show the volume of the commodity. Commodity with high volumes is more liquid compared to the lesser ones. Liquidity in commodity helps in easier and faster execution of the order. 

The Orange colour lines are the trend lines drawn by connecting two or more price points and used for trend identification purposes. The trend line also acts as a line of support and resistance.

Technical Indicators Defined: -

Support: A level at which the stock prices tend to find support if they are falling, and a downtrend may take a pause backed by demand or Selling interest. Support 1 refers to the nearby support level for the stock and if the price breaches the level, then Support 2 may act as the crucial support level for the stock.

Resistance: A level at which the stock prices tend to find resistance when they are rising, and an uptrend may take a pause due to profit booking or Selling interest. Resistance 1 refers to the nearby resistance level for the stock and if the price surpasses the level, then Resistance 2 may act as the crucial resistance level for the stock.

Stop-loss: It is a level to protect further losses in case of unfavourable movement in the stock prices.

Risk Reward Ratio: The risk reward ratio is the difference between an entry point to a stop loss and profit level. This report is based on ~80% Stop Loss of the Target 1 from the entry point.

The reference date for all price data, volumes, technical indicators, support, and resistance levels is 30th May 2025. The reference data in this report has been partly sourced from REFINITIV.

Note: Trading decisions require a thorough analysis by individuals. Technical reports, in general, chart out metrics that may be assessed by individuals before any commodity evaluation. The above are illustrative analytical factors used for evaluating the commodity; other parameters can be looked at along with additional risks per side.


Disclaimer-

This report has been issued by Kalkine Pty Limited (ABN 34 154 808 312) (Australian financial services licence number 425376) (“Kalkine”) and prepared by Kalkine and its related bodies corporate authorised to provide general financial product advice. Kalkine.com.au and associated pages are published by Kalkine.

Any advice provided in this report is general advice only and does not take into account your objectives, financial situation or needs. You should therefore consider whether the advice is appropriate to your objectives, financial situation and needs before acting upon it.

There may be a Product Disclosure Statement, Information Statement or other offer document for the securities or other financial products referred to in Kalkine reports. You should obtain a copy of the relevant Product Disclosure Statement, Information Statement or offer document and consider the statement or document before making any decision about whether to acquire the security or product.

Choosing an investment is an important decision. If you do not feel confident making a decision based on the recommendations Kalkine has made in our reports, you should consider seeking advice from a financial adviser, stockbroker or other professional (including taxation and legal advice) before acting on any advice in this report or on the Kalkine website. Not all investments are appropriate for all people.

The information in this report and on the Kalkine website has been prepared from a wide variety of sources, which Kalkine, to the best of its knowledge and belief, considers accurate. Kalkine has made every effort to ensure the reliability of information contained in its reports, newsletters and websites. All information represents our views at the date of publication and may change without notice. The information in this report does not constitute an offer to sell securities or other financial products or a solicitation of an offer to buy securities or other financial products. Our reports contain general recommendations to invest in securities and other financial products.

Kalkine is not responsible for, and does not guarantee, the performance of the investments mentioned in this report This report may contain information on past performance of particular investments. Past performance is not an indicator of future performance. Hypothetical returns may not reflect actual performance. Any displays of potential investment opportunities are for sample purposes only and may not actually be available to investors. To the extent permitted by law, Kalkine excludes all liability for any loss or damage arising from the use of this report, the Kalkine website and any information published on the Kalkine website (including any indirect or consequential loss, any data loss or data corruption). If the law prohibits this exclusion, Kalkine hereby limits its liability, to the extent permitted by law, to the resupply of services..

Please also read our Terms & Conditions and Financial Services Guide for further information. Employees and/or associates of Kalkine and its related entities may hold interests in the securities or other financial products covered in this report or on the Kalkine website. Any such employees and associates are required to comply with certain safeguards, procedures and disclosures as required by law.

Kalkine Media Pty Ltd, an affiliate of Kalkine Pty Ltd, may have received, or be entitled to receive, financial consideration in connection with providing information about certain entity(s) covered on its website including entities covered in this Report.

Past performance is not a reliable indicator of future performance.