Kalkine has a fully transformed New Avatar.

Company Overview: Bank of Queensland Limited (BOQ) is an Australia-based financial company. The Company's segments include Banking and Insurance. The Banking segment includes retail banking, commercial, personal, small business loans, equipment, debtor finance, treasury, savings and transaction accounts. The Insurance segment includes customer credit insurance, life insurance, accidental death insurance, funeral insurance and motor vehicle gap insurance. The Company's online banking services include Internet banking, mobile banking, BOQ property application, online applications and BOQ money. The Company's personal banking offering includes everyday banking, savings and investment, credit cards, personal loans, home loans, insurance, international services, investing, private bank and account switching among others. Its business banking includes transaction accounts, investment accounts, statutory trust accounts, investment trust accounts, business loans, cash flow finance and equipment finance.
.png)
BOQ Details
Improving Business Mix, Channel, and Geography- Catalyst for Growth: Bank of Queensland (ASX: BOQ) happens to be one of Australia’s leading regional banks with the market capitalization of ~$3.71 Bn as of March 21, 2019. The bank’s management had reflected favourable views with respect to the FY 2018 results and they stated that the strategy they have been implementing from the past few years has transformed the bank into the resilient, multi-channel business which happens to be diversified geographically. During FY18, the bank posted good underlying result amidst significantly difficult operating environment. The bank’s asset quality throughout the loan portfolio witnessed improvement, and this remains the primary strength of the bank. Moving forward, there are expectations that a robust capital position would support the broader performance of the bank and might also improve the returns of shareholders. The bank had stated that it witnessed a significant shift in the business mix and its strategy with regards to the diversification of the channels delivered material benefits. The bank is in a resilient position thanks to the improvements in business mix, channel, and geography. In FY 2018, of the loan portfolio, loans which have been originated through Virgin Money Australia and BOQ Specialist accounted for 20%. The bank has made progress with respect to digitizing the back office and systems and operations. We expect that the bank would be supported by its resilient asset quality, robust capital position, disciplined approach towards operating expenses and deployments towards technology. In addition, its high-quality portfolio coupled with the diversified liquid assets might act as the key growth catalysts for the long-term. Given the backdrop of aforesaid facts, we expect these metrics will gradually improve over the coming years. At CMP of $9.140, the stock of the bank is trading at P/E multiple 7.54x of FY20E EPS. Keeping the view of a decent outlook in the business amidst short-term headwinds, we have valued the stock using the Relative valuation method (Price/Cash Flow ratio) and five-year average P/E of 11.6x for FY20E with consensus EPS of $ 0.83 and have arrived at target price upside of about single digit (in %). Key risks related to rating: regulatory risk, intense competition, and prolonged low interest rate environment, etc.
.png)
Key Financial Metrics (Source: Company Reports, Thomson Reuters), GLA- Gross Loans & Advances Assets
A Look at Key Updates: Bank of Queensland had made an announcement about the retirement of Mr. Peter Deans, Chief Risk Officer after serving the bank for the period of 7 years and spending 32 years in banking. He has given notice for the same on May 31, 2019 and he had also agreed to an ongoing consulting arrangement until 31 December 2019 which would help in the smooth transition. Thanks to his leadership, the bank’s risk capabilities have matured and BOQ’s risk metrics witnessed significant improvement.
The bank had also made an announcement that the agreement to unload St Andrew’s Insurance to Freedom Insurance Group has been terminated. This decision to terminate was mutually agreed with Freedom Insurance after it was clear that conditions of the transaction would not be satisfied within the time limits which were in the sale agreement.
Positive Trend in Dividends Reflects Decent Fundamentals: Bank of Queensland has been declaring a decent number of dividends even though it operates in a challenging environment which demonstrates that the bank is possessing decent fundamentals. The bank declared final ordinary dividend amounting to 38 cents per share and, thus, the full year dividend stood at 76 cents per share which is the same as was declared in the previous year. In FY 2018, the bank has declared $329 million in the form of dividends for the ordinary shareholders. The bank’s statutory dividend pay-out ratio to ordinary shareholders stood at 89.3% in FY 2018 while in FY 2017 it was 78%. The bank’s annual dividend yield stood at 8.23% which is higher than the industry median (Banking Services) of 6.6% which highlights the strength of its fundamentals. The higher-than-industry median yield might attract the attention of market players moving forward.
.png)
Dividend Pay-out Ratio (Source: Company Reports)
Resetting of Common Equity Tier 1 Capital target range: The capital management strategy of Bank of Queensland focuses on ensuring that adequate capital levels are maintained so that deposit holders can be protected. The minimum Common Equity Tier 1 Capital target range has been revised upwards by 25 basis points (or bps) and, as a result, it now happens to be in the range of 8.25% and 9.5% while The Total Capital range is now in the range of 11.75% and 13.5%. As at November 30, 2018, Common Equity Tier 1 Capital Ratio stood at 9.1% as compared to 9.3% as of August 31, 2018. However, the Total Capital Ratio stood at 12.6% while, as at August 31, 2018, it was 12.8%. The bank’s average LCR (or Liquidity Coverage Ratio) over the quarter ended November 2018 stood at 132% which happens to be marginally lower than the previous August quarter average of 136%. Net Cash Outflows (or NCO) of Bank of Queensland witnessed the rise over the quarter ended November 2018 because of increased customer deposits and contractual funding obligations. The bank maintains the portfolio of high quality, diversified liquid assets so that balance sheet liquidity can be facilitated, and internal and regulatory requirements can be met. We expect that this might support the bank’s long-term commitments.
.png)
Capital Adequacy (Source: Company Reports)
Higher Average Interest-Earning Assets, NIMs Aided NII: The Net interest income of BOQ witnessed a rise of 4% in FY 2018 on YoY basis and stood at $965 million on the back of five bps improvement witnessed in NIM and 2% percent rise encountered in average interest-earning assets. The rise in the margins was mainly because of the improvement in funding costs. The bank’s non-interest income amounted to $145 million in FY 2018 reflecting a fall of 17% on YoY basis. There was an industry-wide fall in the income from interchange fees, and the bank also witnessed lower merchant fees. As a result of these, there was a 3% fall in banking income in FY18. Also, their ongoing trends in customers opting low or no fee banking products weighed over the banking income.
.png)
BOQ’s Net Interest Margins (Source: Company Reports)
BOQ Witnessed Improvement in Lending Growth: The lending growth of Bank of Queensland witnessed improvement in FY 2018 because of strong new business acquisition throughout the niche customer segments in BOQ Business and BOQ Finance. However, continued momentum in VMA housing portfolio and improved retention throughout the BOQ branch network have also aided lending growth. The bank was able to balance margin and asset quality in FY 2018 with the focus towards low-cost deposit acquisition. At the end of FY 2018, the bank’s net loans and advances amounted to $45.07 billion which implies the rise of 3% on the YoY basis. The bank stated that the lending growth got almost fully financed with the help of customer deposits which highlights the bank’s strong footing. We expect that the prudent management of the expense growth would continue to improve the bank’s position to make further deployments in business. The bank’s cost-to-income ratio stood at 52.4% in FY 2018 which can be considered decent as there has been increased competition in the broader industry. We expect that the disciplined approach towards expenses would support its cost-to-income ratio.
.png)
Loan Portfolio Mix and Cost-to-Income Ratio (Source: Company Reports)
What to Expect from BOQ in 1H FY 2019: Considering the January year-to-date performance, cash earnings after tax of Bank of Queensland in 1H FY 2019 is anticipated to be between $165 million-170 million as compared to 1H FY 2018 cash earnings after tax which were $182 million. The fall in income from 1H FY 2018 was mainly because of non-interest income which is anticipated to be $8 million-$10 million lower than the 1H18 level which was $75 million. This is because of downward pressure throughout fee, trading, insurance and other income lines.
There are anticipations that the bank’s net interest income would be broadly in line with 1H FY 2018 level which was $475 million, and the net interest margin is expected to be between 1.93% to 1.95% as compared to 1.97% in 1H FY 2018. The fall in NIM is mainly because of continuing funding cost pressures along with price competition for the new loans. The bank’s capital position remains robust with 1H Common Equity Tier 1 ratio anticipated to be more than 9.1% which was reported in the quarter ended November 2018 Pillar 3 disclosure. For the 2H, the broader market conditions are anticipated to be challenging. The bank expects that regulatory costs would rise as it adapts to the changes in the regulatory requirements and expectations which includes Royal Commission impacts. On April 11, 2019, the bank would be reporting results for 1H FY 2019 (i.e., half year ending February 2019).
What Might Drive Growth For BOQ: Moving forward, Bank of Queensland is expected to be stable mainly aided by its strategy, resilient asset quality, and the deployments. However, the management of the bank had stated that the operating environment would be challenging, and the slowing credit growth, technological change, and increased funding costs might weigh on the earnings growth. The bank has implemented a strategy which places it in a decent position to embrace the opportunities without compromising the practices of robust risk management. The bank has been responding to and adjusting itself for challenges which are being faced by the broader financial sector. Amidst challenges, Bank of Queensland might be supported by the strategy to focus towards the niche segments, being customer focused, and diversification across geographies, channels, and markets so that low-risk growth can be facilitated. The bank has been planning to extend the capability of new Web Experience Platform and progress work on enhancing the internet as well as mobile banking so that better functionality can be delivered.
.png)
Historical P/E Band (Source: Company Reports)
Stock Recommendation: The stock of the Bank of Queensland has delivered the return of 4.41% in the past one month which can be considered a decent return. Moreover, the bank is also possessing respectable dividend yield considering the challenges being faced by the broader financial sector which might attract the attention of market players. Apart from this, the bank is expected to be helped by decent capital position, disciplined management of the expenses deployments towards digital tools, branch network and from the initiatives focused towards digital banking platforms. Keeping the view of a decent outlook in the business amidst short-term headwinds, we have valued the stock using the Relative valuation method (Price/Cash Flow ratio) and five-year average P/E of 11.6x for FY20E with consensus EPS of $ 0.83 and have arrived at target price upside of about single digit (in %). Given the backdrop of aforesaid facts, we expect that the financial metrics will gradually improve over the coming years. Hence, we give a “Buy” recommendation on the stock at the current market price of $9.140 (down 1.1% on 21 March 2019).
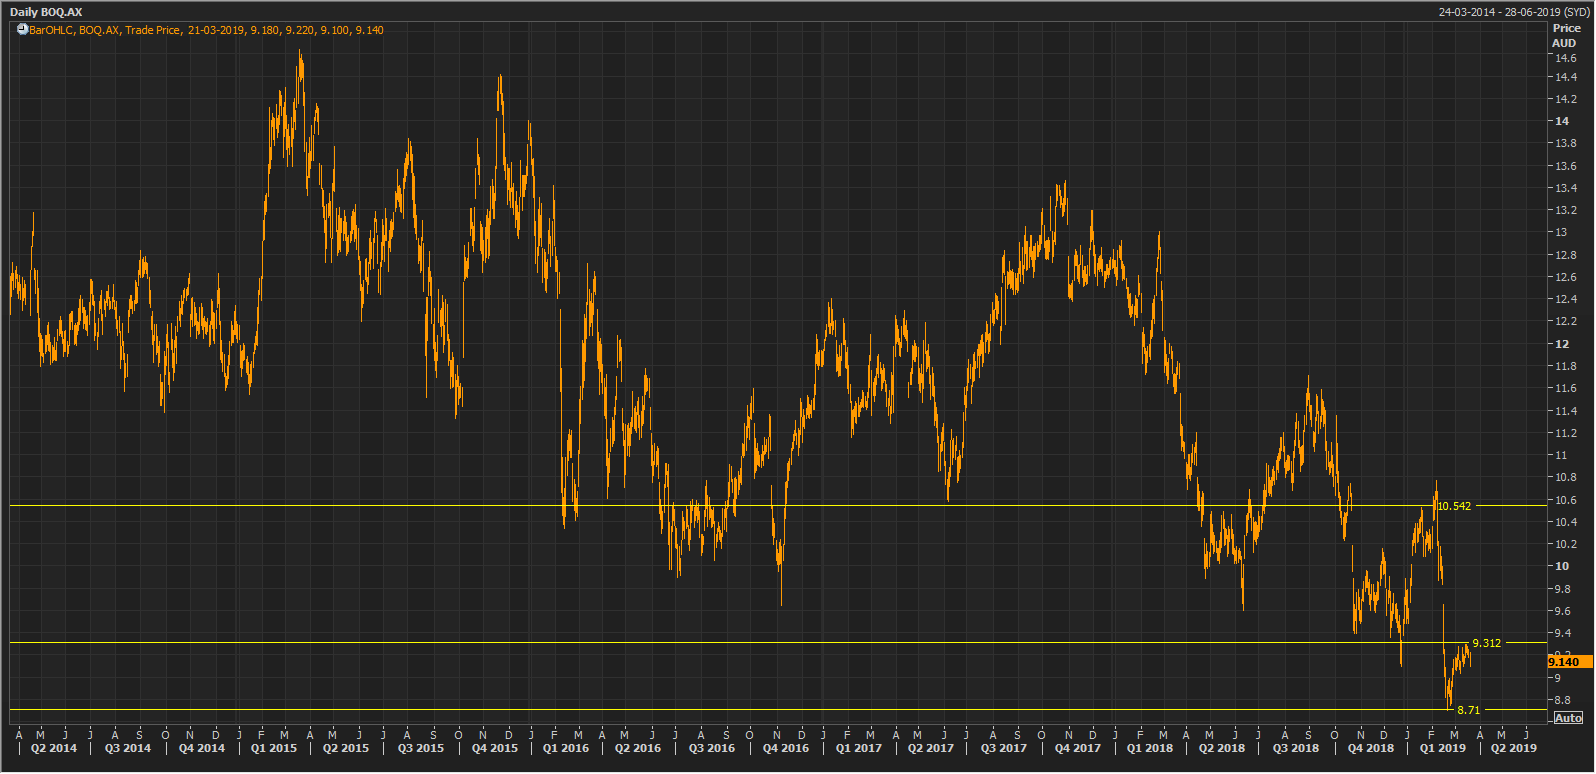
BOQ Daily Chart (Source: Thomson Reuters)
Disclaimer
The advice given by Kalkine Pty Ltd and provided on this website is general information only and it does not take into account your investment objectives, financial situation or needs. You should therefore consider whether the advice is appropriate to your investment objectives, financial situation and needs before acting upon it. You should seek advice from a financial adviser, stockbroker or other professional (including taxation and legal advice) as necessary before acting on any advice. Not all investments are appropriate for all people. Kalkine.com.au and associated pages are published by Kalkine Pty Ltd ABN 34 154 808 312 (Australian Financial Services License Number 425376). The information on this website has been prepared from a wide variety of sources, which Kalkine Pty Ltd, to the best of its knowledge and belief, considers accurate. You should make your own enquiries about any investments and we strongly suggest you seek advice before acting upon any recommendation. Kalkine Pty Ltd has made every effort to ensure the reliability of information contained in its newsletters and websites. All information represents our views at the date of publication and may change without notice. To the extent permitted by law, Kalkine Pty Ltd excludes all liability for any loss or damage arising from the use of this website and any information published (including any indirect or consequential loss, any data loss or data corruption). If the law prohibits this exclusion, Kalkine Pty Ltd hereby limits its liability, to the extent permitted by law to the resupply of services. There may be a product disclosure statement or other offer document for the securities and financial products we write about in Kalkine Reports. You should obtain a copy of the product disclosure statement or offer document before making any decision about whether to acquire the security or product. The link to our Terms & Conditions has been provided please go through them and also have a read of the Financial Services Guide. On the date of publishing this report (mentioned on the website), employees and/or associates of Kalkine Pty Ltd do not hold positions in any of the stocks covered on the website. These stocks can change any time and readers of the reports should not consider these stocks as personalised advice.
Past performance is not a reliable indicator of future performance.
 Please wait processing your request...