Australian Domestic Healthcare - Private Hospital Demand
In this article we look at the Private Health Insurance industry performance, Regulatory & Political Setting along with implications for hospital operators. The Australian Bureau of statistics (ABS) forecasts the Australian population to grow at 1.7% Compound Annual Growth Rate (CAGR) over the next 10 years to 27 Million before slowing to 1.2% CAGR and reaching 37.5Million by 2050. The Australian population like those of other OECD countries is expected to age with an increasing skew towards those aged more than 65. This phenomenon reflects the low birth rates but more significantly ageing of the baby boomer generation. The proportion of the population aged more than 65 was 14.4% in 2013. This forecast to increase at a rate of 0.2% per annum reaching 16.8% by 2023 and 20.9% in 2050.
The ageing of the Australian population places significant demands on the healthcare system with those aged more than 65 over represented in their consumption of health services. In FY13 those aged more than 65 accounted for 43% of hospital episodes and 49% of hospital benefits paid under private health insurance despite representing just 15.5% of people insured. With those aged more than 65 consuming healthcare servei3ces at 2-3 times the rate of the overall population, the trend of an ageing population will contribute to growth in healthcare expenditure. We estimate population trends forecasted by the ABS will support a 23% expenditure growth in hospitals, GP’s, pathology and imaging services. Taking into consideration inflation and increasing utilisation rates over the last 10 years , we derive high single digit growth rates for the aforementioned services.
The benefits paid by private health insurers to hospitals totalled $7.9Billion in the FY13, representing growth of 9% p.a on a 5 year CAGR basis. The insured base since 2008 has grown from 9.5 Million which represents 45% of the population to 10.9Million people which represents 47% of the population. The greatest gains were seen on the proportion of the membership base of those aged more than 65 which increased 5.7% CAGR compared to the rest of the membership at 2.1% CAGR. With those aged more than more than 65 consuming 49% of the hospital benefits paid despite representing just 15% of the membership this demographic shift is favourable to hospital operators but not ideal for insurers. The number of episode per person insured increased from 0.3 in FY08 to 0.34 in FY13. This was driven by both an underlying increase in utilisation and the ageing membership base.
Private health insurance (PHI) along with Federal/State government and contributions from individuals make up the three main pillars of healthcare expenditure funding in Australia. PHI’s significance is much higher in areas such as hospitals and Dental services where it covers 12% and 15 % respectively of Australia’s expenditure. There are two categories of insurance offered by the PHI funds:-
-
Hospital cover – Insurers pay benefits for services received by private patients as an in-patient in both public and private hospitals. The key hospital charges covered include operating theatre and ward care costs and in patient doctor fees (specialist) above the 75% Medicare Benefits Schedule (MBS) rebate. Some policies with more limited coverage may be offered at a lower price. Policies must however provide a minimum level of cover in order for the policy holder to avoid the Medicare levy surcharge and qualify for the PHI rebate.
-
General Treatment or Ancillary Cover - provides cover for treatment that is intended to manage or prevent disease, injury or condition and is not hospital treatment. These include dental, optical and allied health services.
Beyond the value proposition to the individual, Federal governments of both key political parties appear to agree that PHI does reduce the pressure of healthcare costs for governments, particularly given the additional individual funding contribution it facilitates.
The leading insurer in the market is medibank private (including AHM) with 30% share of policies, followed closely by BUPA (including MBF) with a 27% share. The market is highly consolidated with top 5 (of 34) insurers holding more than 80% share of policies on issue.
|
PHI |
Market share |
|
Medibank |
30% |
|
BUPA |
27% |
|
HCF |
11% |
|
HBF |
8% |
|
NIB |
8% |
|
Other |
17% |
Among those listed on the ASX we can look at NIB health funds:-
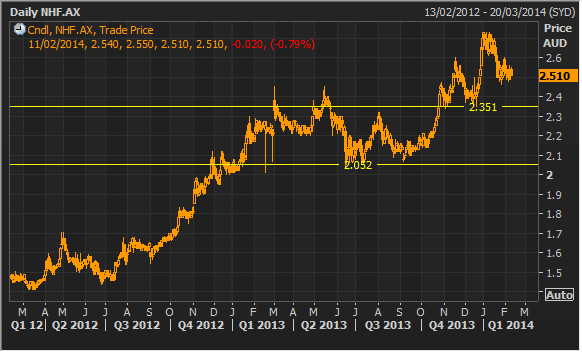
NIB Chart for the last 2 years (Source – Thomson Reuters)
We currently don’t have NIB in the Kalkine Investor Report due to risks associated with the stock. We believe with increasing benefit utilisation, risk equalisation diluting the benefits of the NIB’s younger membership base, future healthcare policy changes seem inevitable in the long term, rising scrutiny of price increases and a private medibank may mean more aggressive competition are some of the risks associated with the stock. We do like the industry fundamentals and attractive long term top line growth prospects with exposure to the expanding health industry and private health insurance playing an important role in funding health spend and balancing demands on government. We will revisit this stock at a later date.
Simplistically speaking, private health insurers make money when the amount they pay out in claims and expenses is less than what they collect in premiums and the returns they make from investing the premium pool. In FY13, private health insurers in aggregate made $757m of net profit which represents a net margin of 4.2%.
Profitability of the private health insurance is highly correlated to government regulation. During the 2007-13 tenure of the previous labour government, PHI was subjected to a trifecta of cuts including means testing of the 30% rebate, each of which weighed on the longer term PHI outlook. Though PHI membership levels have been sustained these cuts created concern around the composition of the membership and the long term outlook. Demographics underpin the growth of older members as a positive for hospital operators but for insurers these members are less profitable. The 2013 election of the Coalition Government endorsed the policy to reverse the cuts when fiscal circumstances allow. In the context of the Medibank Private sale, we believe it is likely that the coalition will examine whether it is prudent to be more specific on the target date for reinstatement of the previous arrangements for the private health insurance premium.
Correlated with government reforms, the PHI industry net profit margin has been tracking down in recent years from near record levels of 5.6% in FY11 to 4.2% in Fy13. Driving this deterioration has been weakness in gross margins which has declined to 13%. Above CPI increases has impacted the affordability of PHI policies resulting in many policyholders adopting cheaper policies that carry higher excesses or more exclusions. Such margins are lower margin for the insurer. The persistent above CPI premium increases has resulted in a bias of incremental membership towards those who stand to benefit most from the insurance cover.
There is historical correlation between the profitability of health insurers and the rate increases insurers are prepared to negotiate with hospital operators. Recent declines in insurer profitability are likely to continue to lead to increased tension around rate increases by insurer, although 3 year agreements stuck with major hospital operators have deferred any risk. In addition to a lower rate increases, private hospitals face the additional pressure of private patients diverting their episodes to public hospitals as they downgrade their level of service.
Private hospitals primary offering is timely access to elective surgery as a private patient and treatment by a doctor of choice. Patients are charged fees for surgical theatre fees and post-operative care/accommodation. The Australian hospital sector consists of 753 public hospitals and 593 (comprising 279 hospitals and 314 freestanding day surgeries) private hospitals. In terms of licensed beds, the public sector has over 58,420 and the private sector has more than 28,351. Of the 279 private hospitals approximately 50% are privately owned (with healthscope and Ramsay Healthcare comprising more than 75%) with the balance owned by not for profit operators (churches and charitable institutions).
|
Private Hospital |
Market share |
|
Ramsay |
29% |
|
Healthscope |
18% |
|
St John of God |
8% |
|
Uniting Healthcare QLD |
4% |
|
Healthe Group |
8% |
|
Other |
33% |
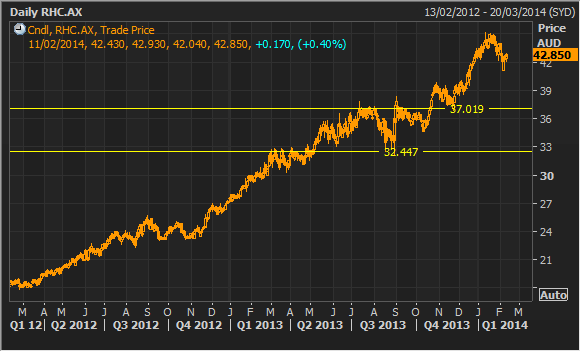
Ramsay Healthcare chart for the last 2 years (Source – Thomson Reuters)
At the current price levels we believe Ramsay healthcare is expensive to buy and has got several risks associated with the stock. Margin pressure could emerge if the Australian government restricts funding for private health insurers or introduces other regulatory changes that discourage PHI policy ownership. The outlook for private hospitals in Europe is less attractive, which has slowed Ramsay’s acquisitions in the recent years. Ramsay trades on high multiples, which could recede in response to increased costs or weakness in reimbursements. We will revisit this stock at a later date.
Private hospitals and day surgeries provided 3.75m or around 40% of all hospital separations in Australia. Private hospitals are holding an increasing share of same day separations and a declining share of overnight separations. PHI represents 70% of private hospital funding. If we define the market for private patients to include free standing day facilities and private patients treated in public hospitals, the total available market is $11.7Billion.
The growth in private patients treated in public hospitals continues to be a factor due to incentive for public hospitals and doctors to generate additional revenue via insurers and MBS, bypassing the federal-Commonwealth funding arrangements. Also due to the growth in PHI policies with higher excess or restrictions, where the public system is willing to pay the excess and thus access is at no out of pockets to the patients.
Against available supply we expect demand will continue to support high utilisation rates particularly in metropolitan private hospitals, this would support continued investment in capacity. We also flag a positive for private hospitals if there is a falloff in private patients in public beds post FY15 reduction in Federal contribution for these patients. Many private metro hospitals are routinely full. This is not likely to change in the near term, as the addition of significant new beds is limited by capital and site and the capacity of the public system as an alternative to dramatically increase patient separations is extremely low.
Disclaimer
Kalkine provides general advice on securities. Kalkine does not provide advice that takes into account your, or anybody else’s investment objectives, financial situation or needs. We strongly suggest that you should make your own enquiries about any investments and we strongly suggest you seek advice before acting upon any recommendation. Kalkine Pty Ltd has made every effort to ensure the reliability of information contained in its newsletters and websites. All information represents our views at the date of publication and may change without notice. Employees and/or associates of Kalkine Pty Ltd may hold one or more of the stocks reviewed on this website. On the date of publishing this report (mentioned on the website), employees and/or associates of Kalkine Pty Ltd currently hold positions in: BHP, BKY, KCN, PDN, and RIO. These stocks can change any time and readers of the reports should not consider these stocks as advice or recommendations.
Copyright
Copyright © 2014 Kalkine Pty Ltd ABN 34 154 808 312. No part of this website, or its content, may be reproduced in any form without the prior consent of Kalkine Pty Ltd.
Kalkine is a trading name of Kalkine Pty Ltd ABN 34 154 808 312, which holds Australian Financial Services Licence No. 425376.
Past performance is not a reliable indicator of future performance.

 Please wait processing your request...