Kalkine has a fully transformed New Avatar.

Company Overview: AUB Group Limited, formerly Austbrokers Holdings Limited, is an Australia-based company, which is an equity-based risk management, advice and solutions provider in Australasia. The Company is principally engaged in the provision of insurance broking services, distribution of ancillary products, risk services and conducting underwriting agency businesses. The Company operates in two segments: Insurance Intermediaries and Risk Services. The Company's Insurance Intermediaries segment has equity investments in businesses, which provides insurance and risk related services to clients. The Company's Risk Services segment also has equity investments in businesses, which provide specialist risk solutions primarily in the people and workplace risk areas, and also the provision of ancillary risk assessment and related solutions in the Australian market. Risk Services are provided to insurance companies and to commercial and government clients either directly or through insurance brokers.
AUB Details
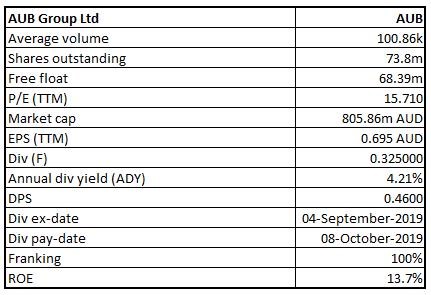
Decent Performance in FY19: AUB Group Limited (ASX: AUB) is focused on insurance broking, underwriting agency and risk management businesses. As on October 10, 2019, the market capitalisation of AUB stood at ~A$805.86 million. Recently, the company delivered a decent set of numbers for FY19, wherein it stated that the company continues to have significant scale and footprint along with an excellent market reputation. Over the past five years, top-line of the company has grown with a compound annual growth rate of ~9.2%, and bottom-line grew at a CAGR of ~8.5% during FY15-19. Total revenue improved from $196.7 Mn in FY15 to $279.8 Mn in FY19, and bottom-line improved from $34.9 Mn in FY15 to $48.4 Mn in FY19. Its Australian Broking, Underwriting Agencies and NZ Broking businesses have demonstrated good performance in FY19, and the company’s Adjusted NPAT rose 10% on a YoY basis (excluding the Canberra results), and, it stated that growth is anticipated to continue in FY20.
With respect to the acquisition growth, AUB undertook major additional equity-steps in BWRS in New Zealand as well as Adroit, financed via a combination of debt and equity from capital raising. The Directors of the company declared a fully franked final dividend of2.5 cents per share, which was payable on October 8, 2019. This, along with an interim dividend amounting to 13.5 cents, resulted in the full-year dividend of 46.0 cents. The net earnings payout ratio came in at 73%. The balance sheet of the company is well-placed, and it would continue its strategy of disciplined acquisitions and supporting the partner businesses to improve underlying performance. AUB has been prudent when it comes to managing capital, and its gearing ratio reduced to 22% in FY19 from 31% in FY18. The business is possessing robust ongoing cash flow generation, while the corporate entity has access to cash and long-term corporate debt facilities in order to finance future acquisition and organic growth initiatives. Based on the foregoing, we have valued the stock using two relative valuation methods, i.e., EV/EBITDA and P/BV multiples, and 3-year average P/E market multiples of ~17.7x to FY20E consensus EPS of $0.662 and have arrived at a target price upside in the range of $11.76 to $12.20 (high single-digit to low double-digit upside (in percentage term). At CMP of $10.94, the stock of the company is trading at P/E multiple 16.53x of FY20E EPS.
.png)
Key Financial Highlights (Source: Company Reports, Thomson Reuters)
Top 10 Shareholders: The following table provides a broader overview of the top 10 shareholders in AUB:
.png)
Top 10 Shareholders (Source: Thomson Reuters)
Key Margins Higher Than Industry Median: The company’s net margin stood at 17.6% in FY19, which is higher than the industry median of 5.1% and, thus, it can be said that AUB has better capabilities to convert its top-line into the bottom-line as compared to the broader industry. EBITDA margin stood at 16.5% in FY19 as compared to the industry median of 12.4%. RoE came in at 13.7% in FY19 while the industry median figure stood at 10.3% and, therefore, it can be said that the company has been delivering better returns to its shareholders as compared to the peer groups. This might help it in gaining traction among the market participants. Debt/Equity ratio stood at 0.25x in FY19, which reflects a fall from FY18 figure of 0.42x and, thus, it looks like that the company has deleveraged its balance sheet. Generally, lesser debt on the balance sheet reflects stability and might help the company focus on its long-term growth objectives. In FY19, the company’s percentage long-term debt to total capital stood at 14.5% in FY19 as compared to 23.5% in FY18 and, therefore, it can be said that AUB has reduced its exposure towards the long-term debt which might help moving forward.
.png)
Key Metrics (Source: Thomson Reuters)
Update on Final Dividend for FY19: Based on the performance in FY19, the Board of Directors declared a fully franked final dividend of 32.5 cents for FY19 and reinstated DRP (or Dividend Reinvestment Plan). In the month of August 2016, the company announced the suspension of DRP and the last dividend that the DRP was applied to was paid in the month of April 2016. As per DRP rules, AUB was required to pay the shareholders participating in DRP any residual funds which were being held in their DRP accounts and provide them with their individual plan accounts upon the suspension of DRP. It stated that those actions have not been completed yet because of administrative oversight, however, they are now being completed (and those shareholders would be receiving the interest at 10% p.a. to account for time delay).
Rise Witnessed in Net Assets: The company’s net assets as at June 30, 2019, amounted to $483.4 million as compared to FY18 figure of $357.2 million. During FY19, the company has acquired the controlling interests in 4 entities, previously accounted for as the associates, which led to an increase in the total assets and liabilities. The company’s gearing decreased and stood at 22% in FY19 as compared to 31% in FY18 because of partial repayment of the loan facility, due to $116 million capital raising in the late calendar year 2018. It was added that the parent entity was having cash and undrawn committed facilities amounting to $111.8 million as at June 30, 2019. The following image has been extracted from the FY19 results analyst pack:
.png)
Overview of Balance Sheet (Source: Company Reports)
Dividend on Rise: The Board of the company declared a fully-franked final dividend amounting to 32.5 cents per share, which brings total dividends declared to 46.0 cents, reflecting a rise of 1.1% as compared to FY18. The final dividend was payable on October 8, 2019, to the shareholders on the record date of September 5, 2019. The company stated that DRP arrangements would be activated.
.png)
Shareholder Returns (Source: Company Reports)
As can be seen from the above figure, the company’s dividend per share has witnessed a CAGR growth of 8% between the time span of FY10-19 and, thus, it can be said that AUB has a decent fundamental and generate more income for its shareholders. The annual dividend yield of the company is about 3.84% on a five-year average basis (FY15-19). At the current market price of A$10.940 per share, the annual dividend yield of AUB stood at 4.21%.
Rise in Adjusted NPAT: In FY19, the company’s net profit after tax (Reported NPAT) attributable to the equity holders of AUB Group amounted to $48.4 million as compared to $46.5 million in FY18, reflecting a rise of ~4.1% on a YoY basis. Adjusted NPAT happens to be a key measure which is being used by the management and Board in order to assess as well as review the business performance. The company benefited from a rise in the ownership in Australian broking businesses (44% of Adroit Holdings, 17% of the Northlake Holdings) as well as New Zealand broking businesses (50% of BrokerWeb Risk Services) and an acquisition within the underwriting agency business (i.e., 50% of Cinesura Pty Ltd). The company’s adjusted NPAT amounted to $46.3 million in FY19, which implies a rise of 4.1% on a YoY basis. The following image reflects robust cash generation as per the FY19 information:
.png)
Robust Cash Generation (Source: Company Reports)
What To Expect From AUM Moving Forward: In the release dated August 20, 2019, the company stated that its guidance for Adjusted Net Profit After Tax growth for FY20 in the range of 4%- 6% (from FY19 comparative base of $46.4 million) includes estimate in the range of $1.5 to $2.0 million (post-tax) of the one-off major acquisition legal and financing costs. After adjusting for the costs, the guidance would be increasing to 8%- 10% growth. During FY20, the company expects robust growth from the Insurance Broking in Australia and New Zealand and the Underwriting Agencies. This might be reduced mainly by reduction in interest rates, lease accounting changes and lag to benefit from the cost-out activities.
.png)
M&A Transaction Activity (Source: Company Reports)
The company and broader insurance market have been benefitted from the pricing tailwinds in the past few years, and AUB is expecting this to continue, though, at a slower rate. The company’s strategic plan revolves around the expansion of the existing portfolio in order to drive further organic growth as well as a continued disciplined approach to M&A activity. The company’s strategic priorities primarily include implementing the best-in-house technology features throughout the group and reducing the corporate costs as well as drive efficiency through the cross-network synergies.
.png)
Key Valuation Metrics (Source: Thomson Reuters)
Valuation Methodologies:
Method 1: PB- based Valuation
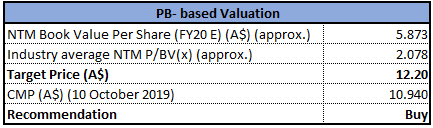
PB- based Valuation (Source: Thomson Reuters), *NTM: Next Twelve Months
Method 2: EV/EBITDA Multiple Approach
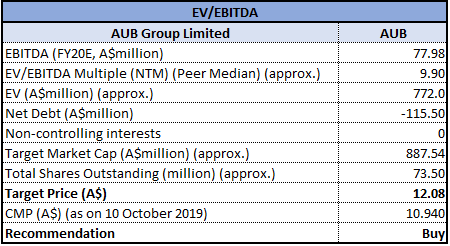
EV/EBITDA Multiple Approach (Source: Thomson Reuters)
Note: All forecasted figures and peers have been taken from Thomson Reuters, *NTM: Next Twelve Months
(2).png)
Historical PE Band (Source: Thomson Reuters)
Stock Recommendation: The stock of AUB has witnessed a fall of 1.18% in the span of the previous three months, while in the time frame of the past six months, the stock has fallen 14.69%. As per ASX, the stock is trading close to the lower band of its 52-week trading range of $10.150 and $13.940, with PE multiple of 15.71x, exhibiting a decent opportunity for accumulation. Moreover, the company’s FY20 strategic priorities include consolidating the core businesses for scale and create sector specialisations to build market leadership, executing on strategically aligned acquisitions which drive outperformance, and redefining risk services strategy. The company has witnessed a CAGR growth in its earnings per share between the time span of FY10- FY19 on adjusted basis of 6.1%, which can be considered at decent levels. Based on the foregoing, we have valued the stock using two relative valuation methods, i.e., EV/EBITDA and P/BV multiples, and 3-year average P/E market multiples of ~17.7x to FY20E consensus EPS of $0.662 and have arrived at a target price upside in the range of $11.76 to $12.20 (high single-digit to low double-digit upside (in percentage term). Hence, we give a “Buy” recommendation on the stock at the current market price of A$10.940 per share (up 0.183% on 10 October 2019).
.png)
AUB Daily Technical Chart (Source: Thomson Reuters)
Disclaimer
The advice given by Kalkine Pty Ltd and provided on this website is general information only and it does not take into account your investment objectives, financial situation or needs. You should therefore consider whether the advice is appropriate to your investment objectives, financial situation and needs before acting upon it. You should seek advice from a financial adviser, stockbroker or other professional (including taxation and legal advice) as necessary before acting on any advice. Not all investments are appropriate for all people. Kalkine.com.au and associated pages are published by Kalkine Pty Ltd ABN 34 154 808 312 (Australian Financial Services License Number 425376). The information on this website has been prepared from a wide variety of sources, which Kalkine Pty Ltd, to the best of its knowledge and belief, considers accurate. You should make your own enquiries about any investments and we strongly suggest you seek advice before acting upon any recommendation. Kalkine Pty Ltd has made every effort to ensure the reliability of information contained in its newsletters and websites. All information represents our views at the date of publication and may change without notice. To the extent permitted by law, Kalkine Pty Ltd excludes all liability for any loss or damage arising from the use of this website and any information published (including any indirect or consequential loss, any data loss or data corruption). If the law prohibits this exclusion, Kalkine Pty Ltd hereby limits its liability, to the extent permitted by law to the resupply of services. There may be a product disclosure statement or other offer document for the securities and financial products we write about in Kalkine Reports. You should obtain a copy of the product disclosure statement or offer document before making any decision about whether to acquire the security or product. The link to our Terms & Conditions has been provided please go through them and also have a read of the Financial Services Guide. On the date of publishing this report (mentioned on the website), employees and/or associates of Kalkine Pty Ltd do not hold positions in any of the stocks covered on the website. These stocks can change any time and readers of the reports should not consider these stocks as personalised advice.
 Please wait processing your request...