Company Overview: Woolworths Group Limited (ASX: WOW) is a publicly traded company operating retail chains, including supermarkets under the Woolworths brand. OOh!media Limited (ASX: OML) is a publicly listed Out of Home media company with a network spanning over 35,000 digital and static asset locations. The company employs approximately 800 people across Australia and New Zealand. This Report covers the Price Action, Technical Indicators Analysis along with the Stop Loss Levels, Target Prices, and Recommendations on these two stocks.
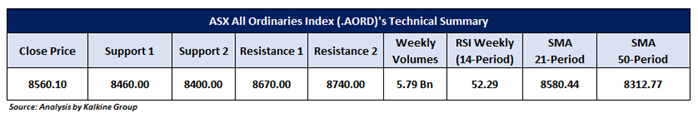
ASX All Ordinaries Index (.AORD) Market Round-Up
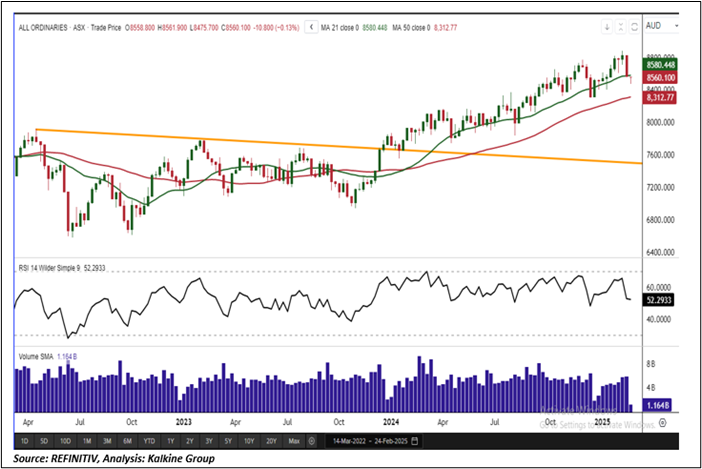
Last week, the ASX All-Ordinaries Index (.AORD) ended in negative territory, tracking the decline in U.S. equity markets. The index closed at 8,570.90, registering a 2.88% loss for the week ending February 21, 2025. The downturn in domestic indices was primarily influenced by bearish signals from global markets, adding to the prevailing negative sentiment.
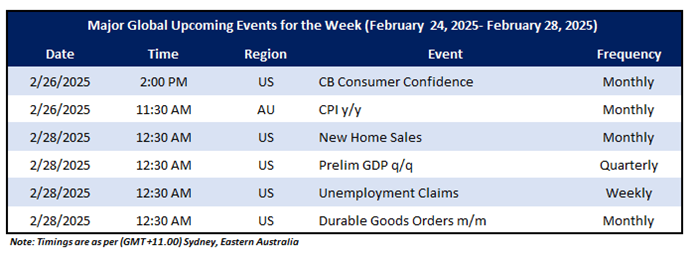
From a technical standpoint, the index prices are holding above the falling trendline and maintaining support at this level. Additionally, they continue to trade above the 50-period SMA, reinforcing it as a critical support zone for the index. The upcoming macroeconomic events that may impact the market sentiments include an update on the AU CPI y/y, US Prelim GDP q/q, and US Unemployment Insurance Claims, etc., released weekly.
Global Markets Wrap-Up
Wall Street indices edged lower last week, closing in negative territory. The S&P 500 ended at 6,013.13, down approximately 1.66%, while the NASDAQ Composite Index closed at 19,524.00, losing around 2.51% for the week ending February 21, 2025. Meanwhile, seasonally adjusted initial U.S. unemployment insurance claims rose by 5,000 to 219,000 for the week ending February 15, 2025, compared to the revised 214,000 in the previous week, according to data from the U.S. Department of Labor.
Having understood the US market performance over the past week, taking cues from major global news, and based on technical analysis of the ASX All-Ordinaries Index (.AORD) for the upcoming week, now let us have a look at two ASX-listed stocks from the technical standpoint. Noted below recommendations are based on entry price, target prices, and stop-loss for Woolworths Group Limited (ASX: WOW) and OOh!media Limited (ASX: OML) for the next 2-4 weeks duration:-
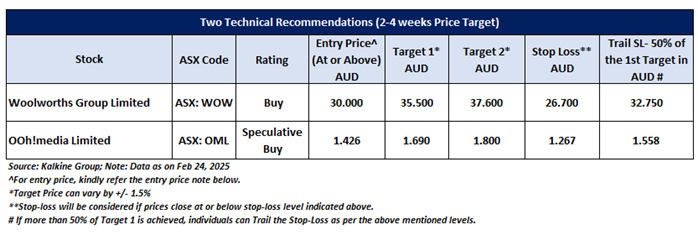
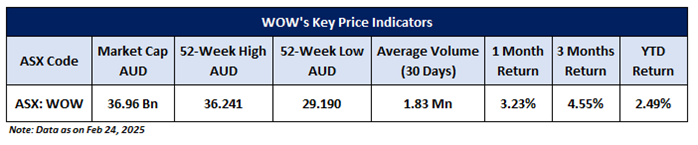
Woolworths Group Limited (ASX: WOW)
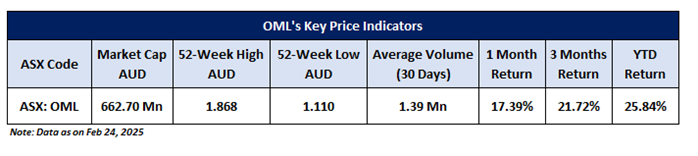
Noted below are the key price indicators for the stock:
Price Action Analysis (on the Daily Chart)
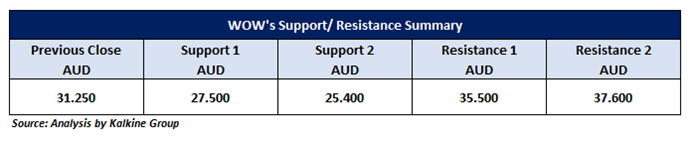
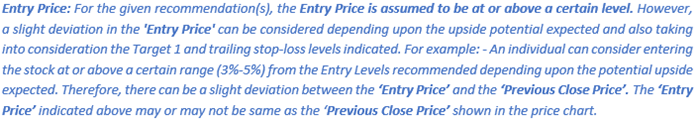
On the daily chart, WOW prices are maintaining support above the falling trendline breakout level, indicating potential upward momentum. Since the breakout, prices have consistently held above the trendline support zone, reinforcing the possibility of further gains. Currently, the stock is approaching its next resistance level at AUD 35.50, and in the short term (2-4 weeks), it may test this level. A breakout above AUD 35.50, supported by strong trading volumes, could drive further buying interest, potentially pushing prices toward the AUD 37.60 level.
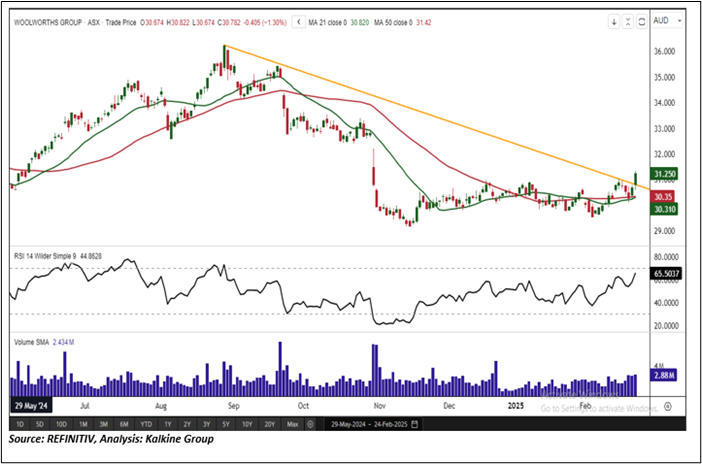
Technical Indicators Analysis (On the Daily Chart)
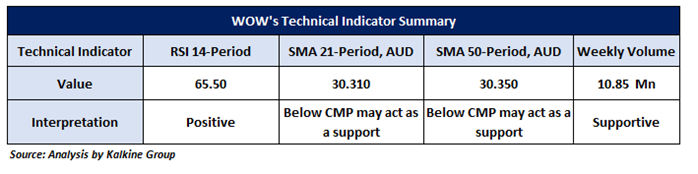
On the daily chart, the 14-period RSI is in the positive zone at approximately 65.50, signaling bullish price momentum. Volume analysis also reflects a positive outlook for the stock. Additionally, the current market price (CMP) is trading above the 21-period SMA, a key trend-following indicator that could serve as a crucial support level, reinforcing the potential for continued upward movement.
General Recommendation:
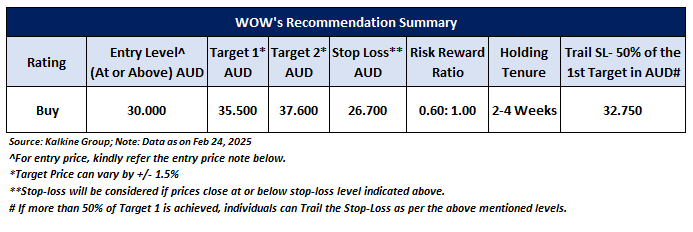
As per the above-mentioned price action and technical indicators analysis, Woolworths Group Limited is looking technically well-placed on the chart, and a ‘Buy’ recommendation has been given on the stock. Investment decision should be made depending on an individual’s appetite for an upside potential, risks, and any previous holdings. This recommendation is purely based on technical indicator analysis, and fundamental analysis has not been considered in this report. Woolworths Group Limited (ASX: WOW) was last covered in a report dated '02 January 2025'. Summary of recommendation is as follows:
OOh!media Limited (ASX: OML)
Noted below are the key price indicators for the stock:
Price Action Analysis (on the Daily Chart)
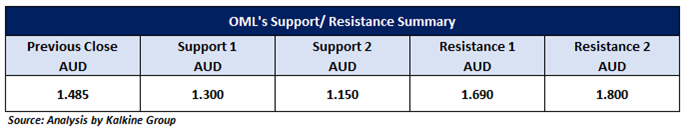
On the daily chart, OML prices are trading above the downward-sloping trendline support and consistently maintaining this level, indicating the potential for further upside momentum. The stock is now approaching its next resistance at AUD 1.69, which it may test in the short term (2-4 weeks). A breakout above AUD 1.69, backed by strong trading volumes, could drive further buying interest, potentially pushing prices toward the AUD 1.80 level.
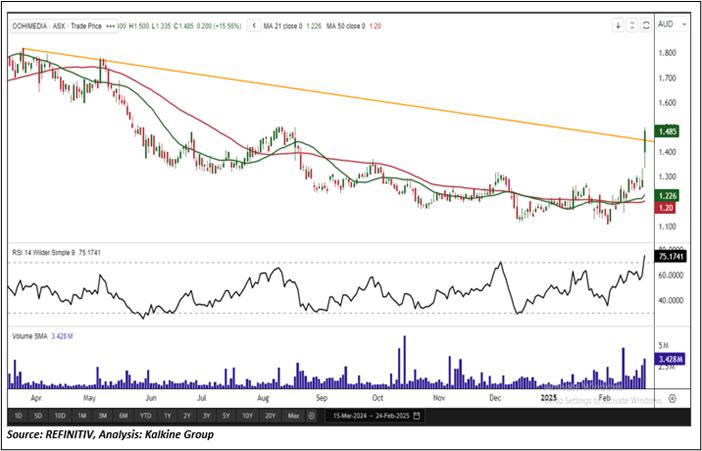
Technical Indicators Analysis (On the Daily Chart)
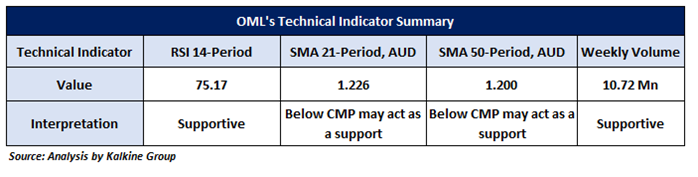
On the daily chart, the 14-period RSI is in the positive zone at approximately 75.17, signaling strong bullish momentum. Additionally, weekly volume trends appear supportive of the ongoing upside movement, reinforcing buying interest. Furthermore, the current market price (CMP) is trading above the 50-period SMA, which serves as a crucial support level, indicating the potential for sustained upward movement.
General Recommendation:
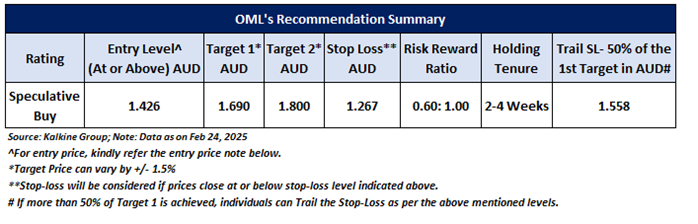
As per the above-mentioned price action and technical indicators analysis, OOh!media Limited is looking technically well-placed on the chart, and a ‘Speculative Buy’ recommendation has been given on the stock. Investment decision should be made depending on an individual’s appetite for an upside potential, risks, and any previous holdings. This recommendation is purely based on technical indicator analysis, and fundamental analysis has not been considered in this report. OOh!media Limited (ASX: OML) was last covered in a report dated '16 October 2024'. Summary of recommendation is as follows:
Markets are trading in a highly volatile zone currently due to certain macro-economic and prevailing geopolitical tensions. Therefore, it is prudent to follow a cautious approach while investing.
Upcoming Major Global Economic Events
Market events occur on a day-to-day basis depending on the frequency of the data and generally include update on employment, inflation, GDP, consumer sentiments, etc. Noted below are the upcoming week's major global economic events that could impact the ASX All-Ordinaries Index and listed stocks’ prices:
Related Risks: This report may be looked at from high-risk perspective and recommendations are provided are for a short duration. Recommendations provided in this report are solely based on technical parameters, and the fundamental performance of the stocks has not been considered in the decision-making process. Other factors which could impact the stock prices include market risks, regulatory risks, interest rates risks, currency risks, social and political instability risks etc.
Note 1: Past performance is not a reliable indicator of future performance.
Note 2:Individuals can consider exiting from the stock if the Target Price mentioned as per the technical analysis has been achieved and subject to the factors discussed above.
Note3: How to Read the Charts?
The Green colour line reflects the 21-period moving average while the red line indicates the 50-period moving average. SMA helps to identify existing price trend. If the prices are trading above the 21-period and 50-period moving average, then it shows prices are currently trading in a bullish trend.
The Black colour line in the chart’s lower segment reflects the Relative Strength Index (14-Period) which indicates price momentum and signals momentum in trend. A reading of 70 or above suggests overbought status while a reading of 30 or below suggests an oversold status.
The Blue colour bars in the chart’s lower segment show the volume of the stock. The volume is the number of shares that changed hands during a given day. Stocks with high volumes are more liquid than stocks with lesser volume. Liquidity in stocks helps in easier and faster execution of the order.
The Orange colour lines are the trend lines drawn by connecting two or more price points and used for trend identification purposes. The trend line also acts as a line of support and resistance.
Technical Indicators Defined: -
Support: A level at which the stock prices tend to find support if they are falling, and a downtrend may take a pause backed by demand or buying interest. Support 1 refers to the nearby support level for the stock and if the price breaches the level, then Support 2 may act as the crucial support level for the stock.
Resistance: A level at which the stock prices tend to find resistance when they are rising, and an uptrend may take a pause due to profit booking or selling interest. Resistance 1 refers to the nearby resistance level for the stock and if the price surpasses the level, then Resistance 2 may act as the crucial resistance level for the stock.
Stop-loss: It is a level to protect further losses in case of unfavourable movement in the stock prices.
Risk Reward Ratio: Risk reward ratio is the difference between an entry point to a stop loss and profit level. This report is based on ~60% Stop Loss of the Target 1 from the entry point.
A trailing stop-loss is a modification of stop-loss in case of favourable movement in the price to protect the gains. Individuals can Trail the Stop-Loss as per the aforementioned levels if the stock price achieves more than 50% of the Target 1.Individuals should consider exiting from the position as per the Trailing Stop-Loss level if the price starts moving downwards after achieving more than 50% of the Target 1.
The reference date for all price data, currency, technical indicators, support, and resistance levels is February 24, 2025. The reference data in this report has been partly sourced from REFINITIV.
Abbreviations
CMP: Current Market Price
SMA: Simple Moving Average
AUD: Australian Dollar
RSI: Relative Strength Index
Note: Trading decisions require a thorough analysis by individuals. Technical reports in general chart out metrics that may be assessed by individuals before any stock evaluation. The above are illustrative analytical factors used for evaluating the stocks; other parameters can be looked at along with additional risks per se. Past performance is neither an indicator nor a guarantee of future performance.
Disclaimer-
This report has been issued by Kalkine Pty Limited (ABN 34 154 808 312) (Australian financial services licence number 425376) (“Kalkine”) and prepared by Kalkine and its related bodies corporate authorised to provide general financial product advice. Kalkine.com.au and associated pages are published by Kalkine.
Any advice provided in this report is general advice only and does not take into account your objectives, financial situation or needs. You should therefore consider whether the advice is appropriate to your objectives, financial situation and needs before acting upon it.
There may be a Product Disclosure Statement, Information Statement or other offer document for the securities or other financial products referred to in Kalkine reports. You should obtain a copy of the relevant Product Disclosure Statement, Information Statement or offer document and consider the statement or document before making any decision about whether to acquire the security or product.
Choosing an investment is an important decision. If you do not feel confident making a decision based on the recommendations Kalkine has made in our reports, you should consider seeking advice from a financial adviser, stockbroker or other professional (including taxation and legal advice) before acting on any advice in this report or on the Kalkine website. Not all investments are appropriate for all people.
The information in this report and on the Kalkine website has been prepared from a wide variety of sources, which Kalkine, to the best of its knowledge and belief, considers accurate. Kalkine has made every effort to ensure the reliability of information contained in its reports, newsletters and websites. All information represents our views at the date of publication and may change without notice. The information in this report does not constitute an offer to sell securities or other financial products or a solicitation of an offer to buy securities or other financial products. Our reports contain general recommendations to invest in securities and other financial products.
Kalkine is not responsible for, and does not guarantee, the performance of the investments mentioned in this report This report may contain information on past performance of particular investments. Past performance is not an indicator of future performance. Hypothetical returns may not reflect actual performance. Any displays of potential investment opportunities are for sample purposes only and may not actually be available to investors. To the extent permitted by law, Kalkine excludes all liability for any loss or damage arising from the use of this report, the Kalkine website and any information published on the Kalkine website (including any indirect or consequential loss, any data loss or data corruption). If the law prohibits this exclusion, Kalkine hereby limits its liability, to the extent permitted by law, to the resupply of services..
Please also read our Terms & Conditions and Financial Services Guide for further information. Employees and/or associates of Kalkine and its related entities may hold interests in the securities or other financial products covered in this report or on the Kalkine website. Any such employees and associates are required to comply with certain safeguards, procedures and disclosures as required by law.
Kalkine Media Pty Ltd, an affiliate of Kalkine Pty Ltd, may have received, or be entitled to receive, financial consideration in connection with providing information about certain entity(s) covered on its website including entities covered in this Report.
Past performance is not a reliable indicator of future performance.
 AU
AU
 Please wait processing your request...