Kalkine has a fully transformed New Avatar.

I. Sector Landscape and Outlook
2020 has been a tough year for policymakers and the general public at large. COVID-19 has been an unprecedented event infecting millions of people across the world, forcing governments to take stringent actions such as impose lockdowns, close borders and trade in an effort to contain the spread of the virus. Although restrictions on people movement by policymakers largely peaked in April, global markets bottomed in March.
In March, the implications of COVID-19 forced policymakers to launch some of the largest stimulus packages, which included fiscal as well as monetary policy initiatives. A lot of liquidity has been pumped into the system by Central Bankers across countries.
Interest rates have come down, quantitative easing is ramped up, and credit creation is ongoing. Bond markets, which were specifically blocked for lower quality borrowers, have eased now and high yield issuance has depicted signs of revival.
Fig 1: Major Global Indices 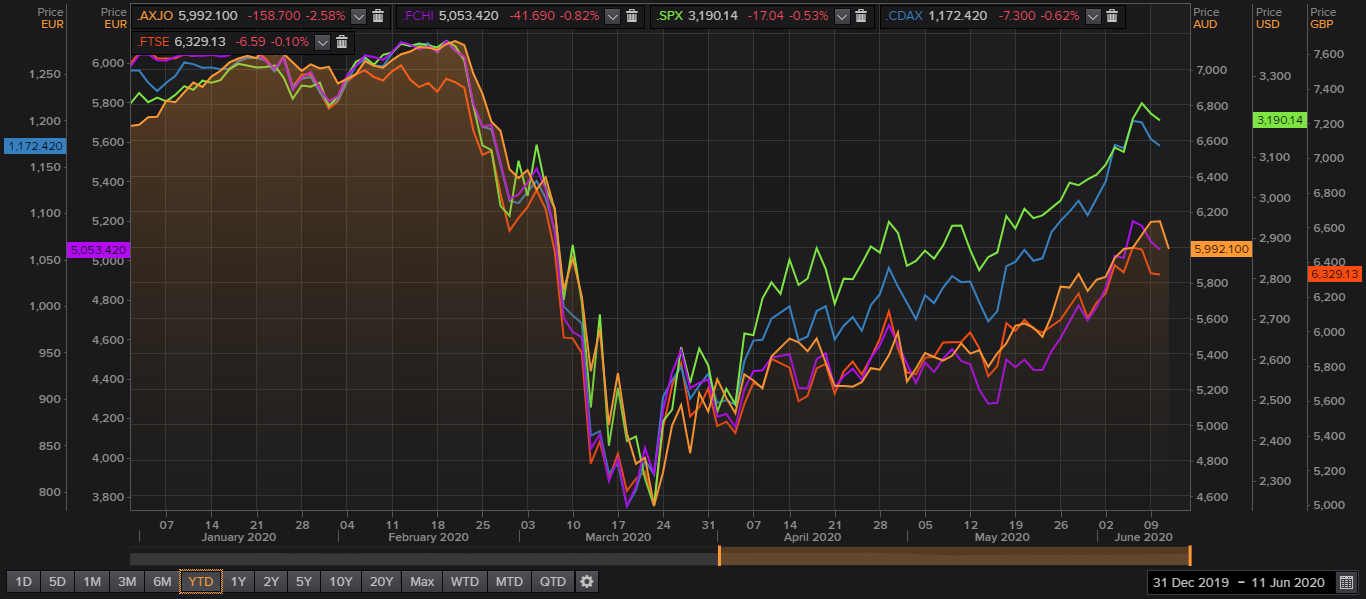
Source: Refinitiv (Thomson Reuters)
For instance, in the US, Ford Motors and General Motors have raised capital through high-yield bonds, indicating that liquidity is back, and investors are willing to allocate capital. Rightly so – Australian Dollar, a leading indicator for the global economy partially due to its large commodity exports, is back at the levels seen at the beginning of this year.
As far as markets are concerned, the US markets are close to the highs recorded this year, while Australian indices have lagged but are picking up gradually. Australia has been proactive in containing the spread of the virus and is recovering from the damage caused by COVID-19 implications.
Since markets have recovered from the lows recorded in March, it also means that assets under management of investment managers may have recovered, providing a relatively better base for fee revenues and fund flows improving with confidence back amongst the investor community.
Let us look at how the industry has performed in the first quarter of 2020.
Short term headwinds do not impact solid long-term fundamentals
Australia’s large and growing superannuation reserves provide a base for fund inflows in asset management businesses in addition to other sources like investments by households. As per the Australian Bureau of Statistics (ABS), as of 31 March 2020, the managed funds industry contracted by 5.9% or $237.7 billion to $3.72 trillion over the previous quarter.
Assets under superannuation funds decreased by 6.9% or $207.9 billion to $2.83 trillion, majorly driven by shares being down 23% or $110.9 billion, units in trust down by $124 billion or 11.4%. However, deposits were up by 15.2% or $35.5 billion, derivatives rose by 53.6% or $16.4 billion, and overseas assets fell by 3.2% or $17.3 billion.
Assets of retail unit trusts fell by 3.8% or $15.6 billion to $397.2 billion, which was largely driven by fall in shares of $7.5 billion or 19.8%, units in trust down 9% or $8.7 billion and overseas assets down by 6.6% or $4.3 billion. But these falls were offset by an increase of 47.9% or $1.7 billion in derivatives and $2.6 billion or 38.8% in deposits.
At the end of March quarter, the managed fund industry’s size was $3.72 trillion, of which around $2.97 trillion was held with managed funds institutions, approximately $622 billion was with institutions other than managed funds, around $134.6 billion of overseas funds were under Australian investment managers, and $11.7 billion of funds were invested by Australian investment managers on behalf of other domestic funds.
Assets under managed funds institutions were $2.97 trillion, of which major chunk was invested in units in trust (27%), overseas assets (20%), shares (17%), and land, building and equipment had a share of 10%.
Fig 2: Asset Allocation of Managed funds institutions as of 31 March 2020
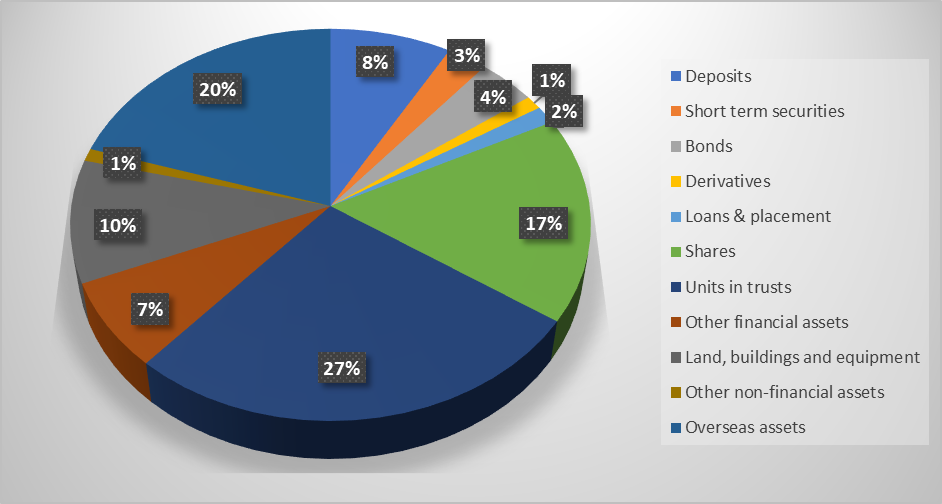
Source: ABS
Quarter over quarter change in assets held by managed funds institutions was $161.5 billion, after assets fell to $2.97 trillion from $3.13 trillion. This contraction was driven by market movements, owing to market sell-off in March.
Fig 3: Q-o-Q change in assets held by managed funds institutions (in millions) 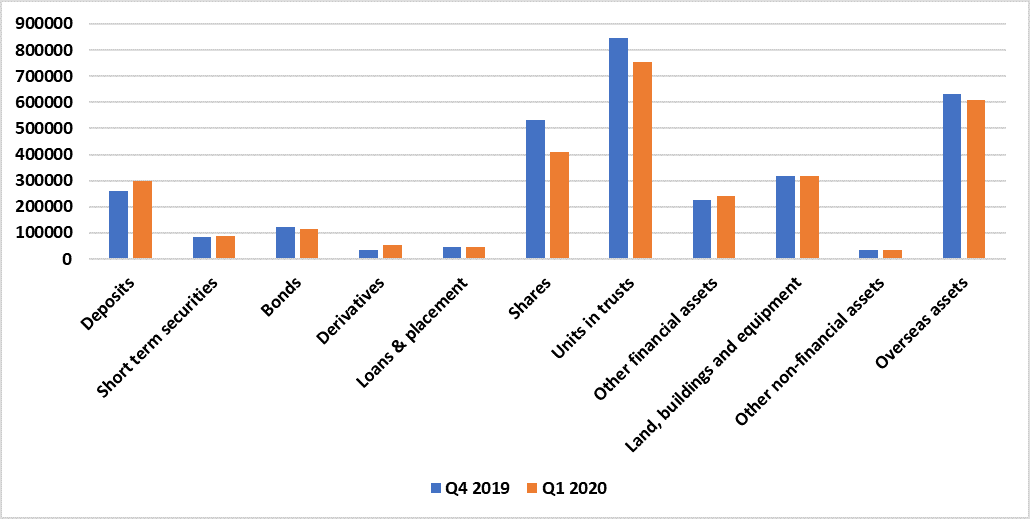
Source: ABS
A contraction of around $161.5 billion was largely driven by 22.6% fall in shares, 10.83% drop in units in trust, and 7.63% fall in bonds, among others. However, this contraction was also offset by an increase in other asset classes, including a 54% increase in the value of derivatives, 6.8% increase in other financial assets and 7.81% rise in other financial assets.
Let us now gauge through the policy measures undertaken by the Australian government that has impacted the industry.
Post March, markets have recovered but redemption pressures are mounting
Although markets have recovered from the March lows, superannuation funds might be facing potential liquidity issues, owing to early super access scheme. Australian government has introduced an early super access scheme, enabling superannuation members to access funds at an early stage. This scheme may see redemptions from investment managers who are managing funds on behalf of super funds in addition to in-house investments by super funds.
The scheme is available to members that are affected by COVID-19, and funds received through early access scheme are not taxable. Members are eligible to apply for up to $20k until 24 September 2020 who are in financial hardship due to COVID-19.
Fig 4: COVID-19 Superannuation Early Release Scheme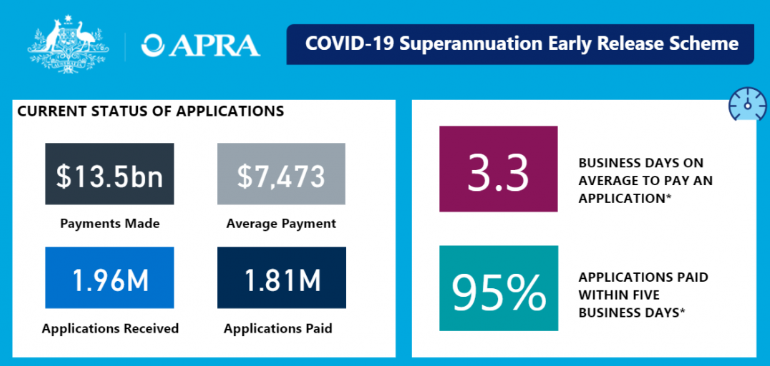
Source: APRA
As a result of the scheme, super funds are paying billions of dollars to the members each week. According to the latest data available at the Australian Prudential Regulatory Authority (APRA), super funds have paid $13.5 billion to members between 20 April 2020 to 31 May 2020.
During the period, the average payment to members was $7.4k and close to 2 million applications were received by the super funds, of which 1.81 million were paid. Interestingly, the ten funds that have received the highest number of applications have paid $8.96 billion and processed 1.22 million payments to the members.
Super funds that have invested in illiquid assets like property and alternative assets were raising concerns about the early access scheme. Policymakers noted that the regulator has the power to merge super funds.
When volatility is persistent in markets, large institutional investors like super fund should not become a forced seller as it would drive down the prices additionally. Many industry participants had raised doubts on the sustainability of super funds due to an offensive asset allocation, which could impact the ability to deliver long term sustainable returns for the members.
Sales commissions have been banned
Investment management businesses used to pay commissions to advisors to promote their products among clients. Federal Treasurer has noted that sales commissions paid by fund managers on new Listed Investment Trusts (LITs) and Listed Investment Companies (LICs) would be banned.
The decision comes after a review conducted by the Treasury Department. Also known as stamping fees, the changes would not impact hybrid securities, listed infrastructure investments and real estate investment trusts. Changes would be effective, starting from 1 July 2020.
With these business dynamics and policy changes we have noticed that the businesses are forced to undertake prudent measures to sustain in the long run, let us look how the big four banks are responding to the new paradigm.
Big four banks have been offloading asset management businesses
Recently, Westpac has initiated a strategic review to consider the path forward for some of its businesses, including investments and retirement products. Now Westpac has joined other big four banks to emphasise on core banking.
Commonwealth Bank had divested Colonial First State Global Investment during 1HFY20. Recently, the bank sold a 55% stake in Colonial First State to KKR. National Bank of Australia is moving to separate MLC Wealth business. ANZ had also separated One Path business last year.
Haynes Royal Commission revealed the financial advice scandals, prompting advice businesses to undertake customer remediation plans, which have resulted in growing expenses. It also made major banks to divest non-core businesses.
Let us understand the risks that asset management companies are exposed to.
Risks in investment management businesses
1. Investment management businesses are susceptible to market movements as it depreciates or appreciates the value of funds under management, that impacts the level of fees earned by the business.
2. Large scale outflows will also lead to lower funds under management, thus fee earnings.
3. Performance fee revenues are cyclical in nature and depend on the level of outperformance delivered by the managers.
4. In the current context, a delay in medical breakthrough or a widespread second-wave of COVID-19 infections could lead to adverse developments in the global economy, thereby capital markets.
5. Regulatory developments in the investment management sector could be either favorable or unfavorable for the businesses.
With the understanding of the risks, let us now look at the factors that could have a bearing on the revenue of AMCs.
Annuity style revenues provide base for shareholders returns, including dividends
Presently, Australian corporates have been preserving cash to navigate the crisis instigated by COVID-19, which has forced companies to defer/cancel dividends, control costs and postpone non-essential capital expenditure.
Revenues of pure-play investment management businesses are mainly derived through management fees and performance fees. Management fee revenue depends on the level of funds managed by a business, while performance fee revenues are cyclical in nature due to dependency on the performance of the funds.
Unless there are large scale redemptions in any investment management business, the management fee revenue is likely to be stable, and funds under management grow – the management fee revenue will grow as well.
Investment management businesses also have capital light business model due to service-oriented business model. In most of the cases, large expenses are related to employees, technology, data, administration, marketing, and occupancy. Consequently, investment management businesses have relatively better profit margins.
After seeing a sharp selloff in March, investors sentiments seem to be back in equity which is driving the stock market across the globe. Flows in Assets under Management (AuM) are directly linked to the performance of the equity market. Most of the Asset managers recorded outflows in March following a free fall in the equity market. Since the equity market is showing signs of strength, flows are likely to be back, which in turn will drive the financials of the Asset Managers.
With the global equity back on ‘Risk On’ mode, evident from swift recovery in market from March lows driven by resumption in economic activity across many countries globally as restrictions continue to ease, the Asset Management Companies could see fund flows moving northwards. We believe this is a sweet spot for AMC businesses as they are better positioned to leverage on the market recovery, moreover there are still ample opportunities for fund mangers’ to cheery pick good businesses with sound fundamentals both across growth and value in the equity universe and other asset classes.
II. Investment Theme and Stock under Discussion (PNI, IFL, MOE, JHG and MFG)
After gauging through the industry dynamics, let us take a detailed look at the companies operating in this sector, in terms of their performance and outlook. We have assessed the companies’ stocks based on Price to Earnings methodology.
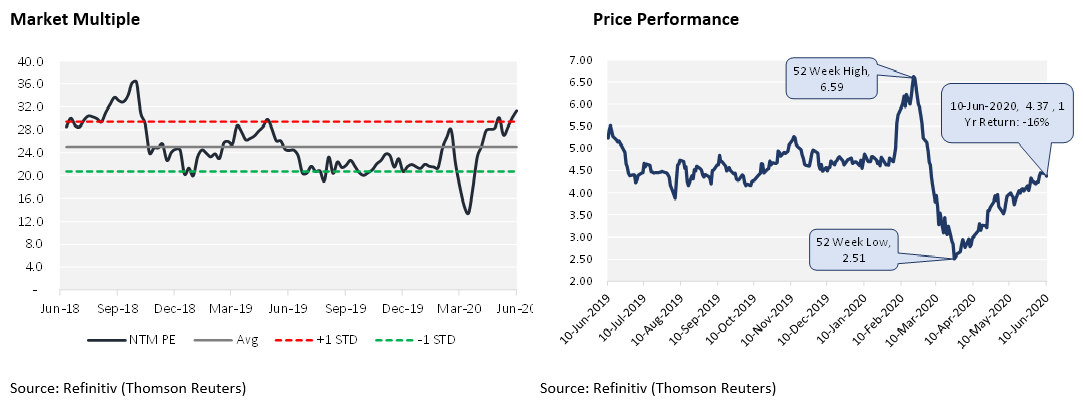
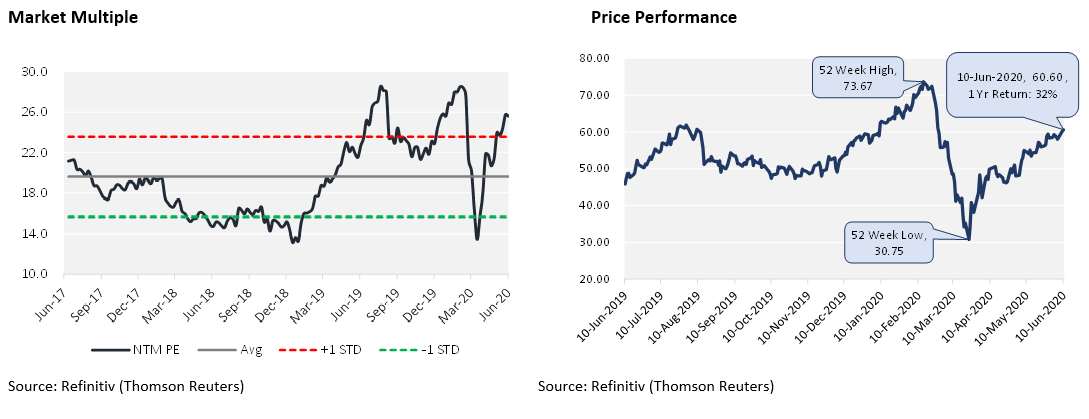
1. ASX: PNI (PINNACLE INVESTMENT MANAGEMENT GROUP LIMITED)
(Recommendation: Buy, Potential Upside: Low Double Digit, Mcap: AUD 824.3 Million)
Pinnacle Investment Management Group Limited is engaged in operating & developing investment management businesses and providing distribution services, business support services to its affiliate.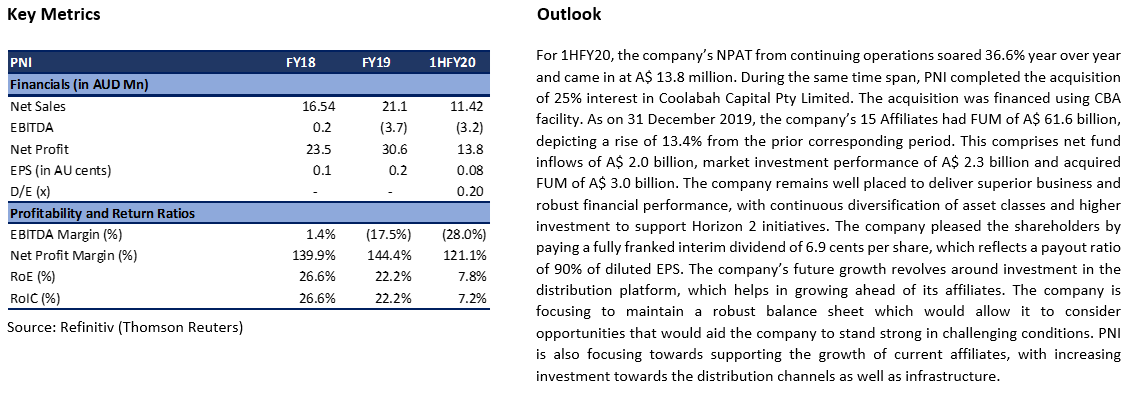
Valuation
Our illustrative valuation model suggests that the stock has a potential upside of ~17% on 11 June 2020 closing price. We have considered Netwealth Group Ltd (ASX: NWL), Magellan Financial Group Ltd (ASX: MFG), and Hub24 Ltd (ASX: HUB) etc., as a peer group for the comparison purpose. At the last traded price, the stock is offering a dividend yield of ~5.3%..png)
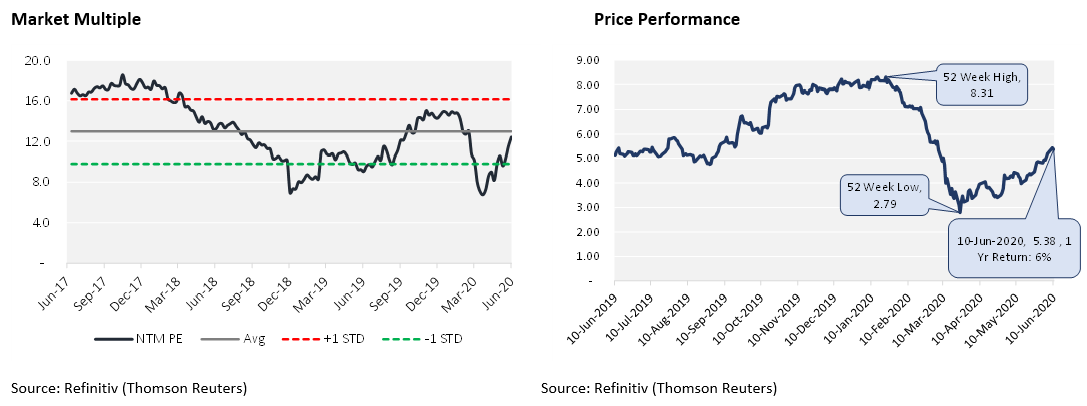
2. ASX: IFL (IOOF HOLDINGS LIMITED)
(Recommendation: Buy, Potential Upside: Low Double Digit, Mcap: AUD 1.91 Billion)
IOOF Holdings Limited is engaged in providing financial advice and distribution, along with portfolio and estate administration, and investment management solutions.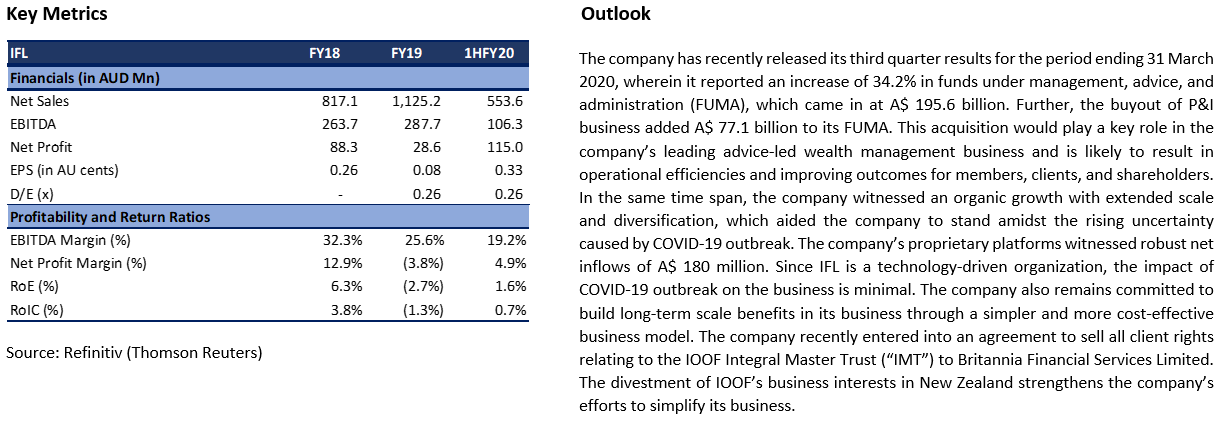
Valuation
Our illustrative valuation model suggests that the stock has a potential upside of ~21% on 11 June 2020 closing price. We have considered Challenger Ltd (ASX: CGF), Perpetual Ltd (ASX: PPT), and Janus Henderson Group (ASX: JHG) etc., as a peer group for the comparison purpose. At the last traded price, the stock is offering a dividend yield of ~7.4%..png)
3. ASX: MOE (MOELIS AUSTRALIA LIMITED)
(Recommendation: Buy, Potential Upside: Low Double Digit, Mcap: AUD 575.8 Million)
Moelis Australia Limited is primarily engaged into financial services business, which includes three units namely Asset Management, Corporate Advisory, and Equities.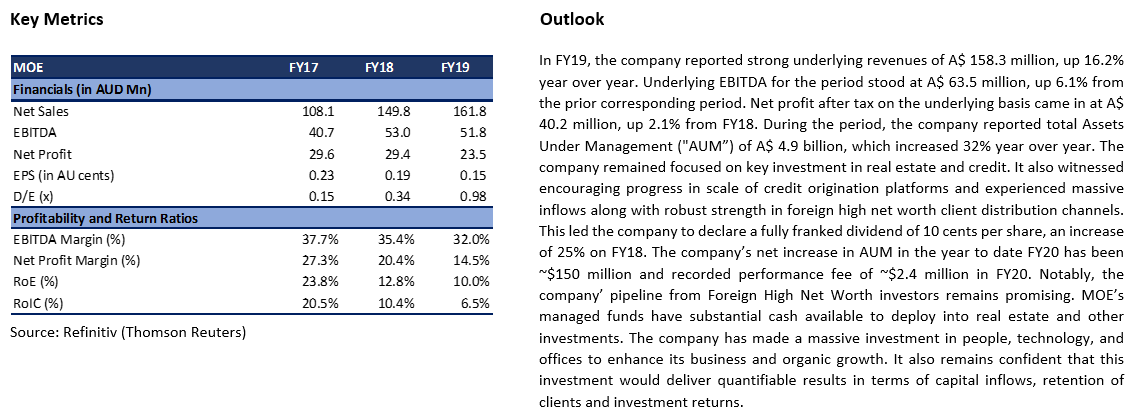
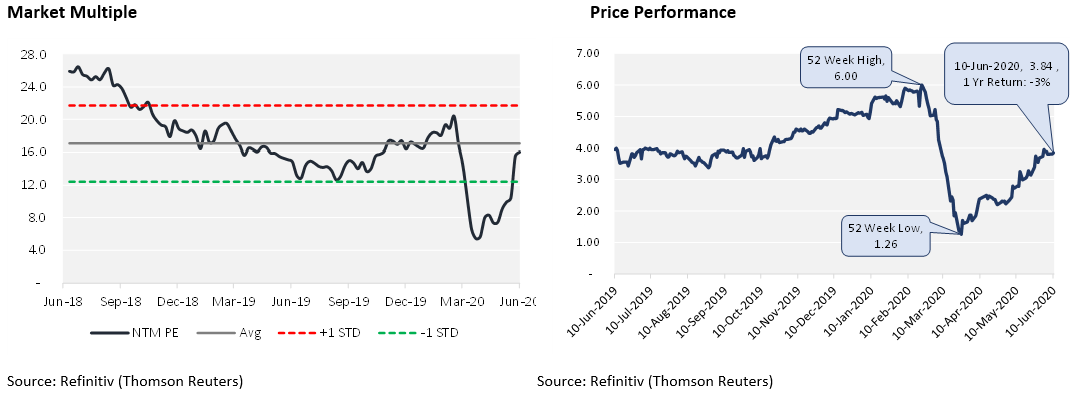
Valuation
Our illustrative valuation model suggests that the stock has a potential upside of ~20% on 11 June 2020 closing price. We have considered Netwealth Group Ltd (ASX: NWL), Navigator Global Investments Ltd (ASX: NGI), and IOOF Holdings Ltd (ASX: IFL) etc., as a peer group for the comparison purpose. At the last traded price, the stock is offering a dividend yield of ~3.7%.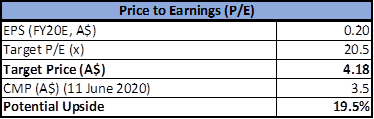
4. ASX: JHG (JANUS HENDERSON GROUP PLC)
(Recommendation: Hold, Potential Upside: High Single Digit, Mcap: AUD 6.71 Billion)
Janus Henderson Group Plc is a global active asset management company that offers a wide range of investment solutions to investors to help them accomplish their long-term financial goals.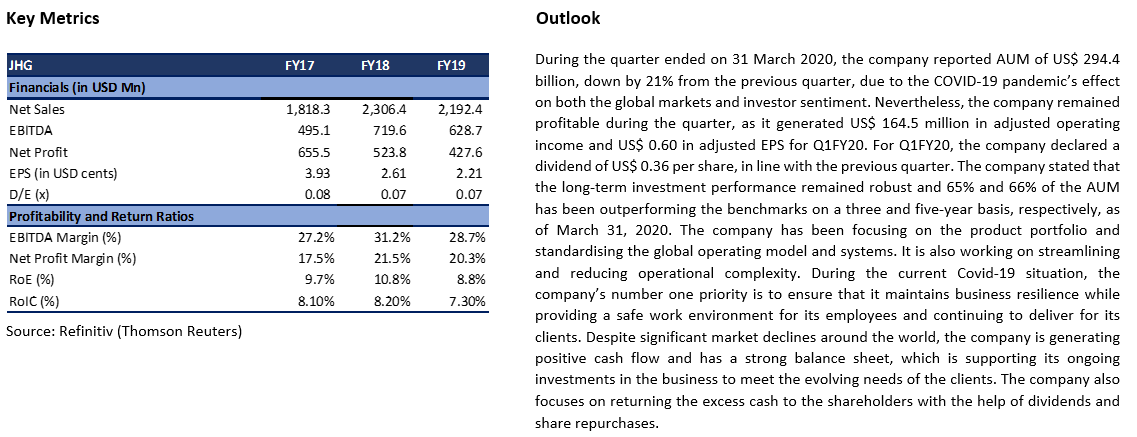
Valuation
Our illustrative valuation model suggests that the stock has a potential upside of ~9% on 11 June 2020 closing price. We have considered T. Rowe Price Group Inc (NYSE: TROW), Pendal Group Ltd (ASX: PDL), and IOOF Holdings Ltd (ASX: IFL) etc., as a peer group for the comparison purpose. At the last traded price, the stock is offering a dividend yield of ~5.9%.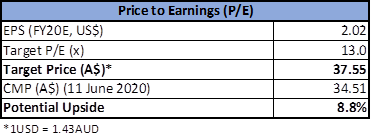
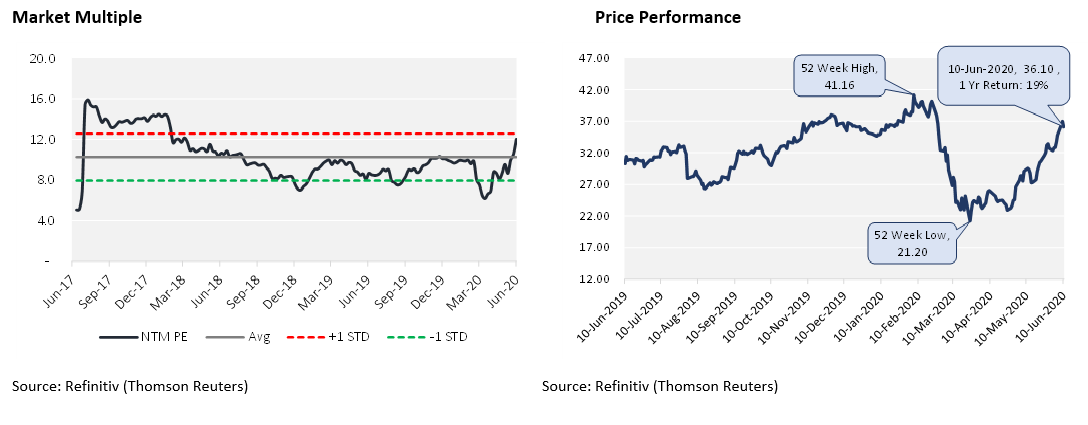
5. ASX: MFG (MAGELLAN FINANCIAL GROUP LIMITED)
(Recommendation: Watch, Potential Upside: High Single Digit, Mcap: AUD 10.99 Billion)
Magellan Financial Group Limited is engaged in the fund management business. The group offers its services to the high net worth and retail investors in Australia and New Zealand.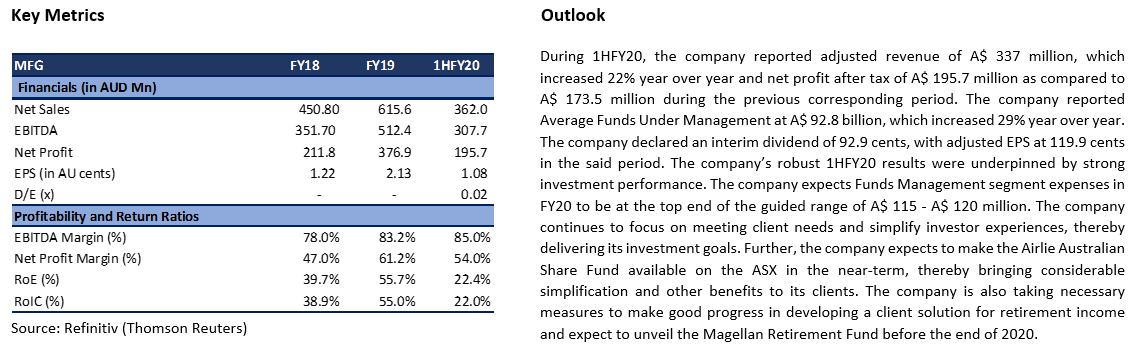
Valuation
Our illustrative valuation model suggests that the stock has a potential upside of ~9% on 11 June 2020 closing price. We have considered Platinum Asset Management Ltd (ASX: PTM), Netwealth Group Ltd (ASX: NWL), and Pinnacle Investment Management Group Ltd (ASX: PNI) etc., as a peer group for the comparison purpose. At the last traded price, the stock is offering a dividend yield of ~4.5%..png)
Note: All the recommendations and the calculations are based on the closing price of 11 June 2020. The financial information has been retrieved from the respective company’s website and Thomson Reuters.
Disclaimer
The advice given by Kalkine Pty Ltd and provided on this website is general information only and it does not take into account your investment objectives, financial situation or needs. You should therefore consider whether the advice is appropriate to your investment objectives, financial situation and needs before acting upon it. You should seek advice from a financial adviser, stockbroker or other professional (including taxation and legal advice) as necessary before acting on any advice. Not all investments are appropriate for all people. Kalkine.com.au and associated pages are published by Kalkine Pty Ltd ABN 34 154 808 312 (Australian Financial Services License Number 425376). The information on this website has been prepared from a wide variety of sources, which Kalkine Pty Ltd, to the best of its knowledge and belief, considers accurate. You should make your own enquiries about any investments and we strongly suggest you seek advice before acting upon any recommendation. Kalkine Pty Ltd has made every effort to ensure the reliability of information contained in its newsletters and websites. All information represents our views at the date of publication and may change without notice. To the extent permitted by law, Kalkine Pty Ltd excludes all liability for any loss or damage arising from the use of this website and any information published (including any indirect or consequential loss, any data loss or data corruption). If the law prohibits this exclusion, Kalkine Pty Ltd hereby limits its liability, to the extent permitted by law to the resupply of services. There may be a product disclosure statement or other offer document for the securities and financial products we write about in Kalkine Reports. You should obtain a copy of the product disclosure statement or offer document before making any decision about whether to acquire the security or product. The link to our Terms & Conditions has been provided please go through them and also have a read of the Financial Services Guide. On the date of publishing this report (mentioned on the website), employees and/or associates of Kalkine Pty Ltd do not hold positions in any of the stocks covered on the website. These stocks can change any time and readers of the reports should not consider these stocks as personalised advice.
 Please wait processing your request...