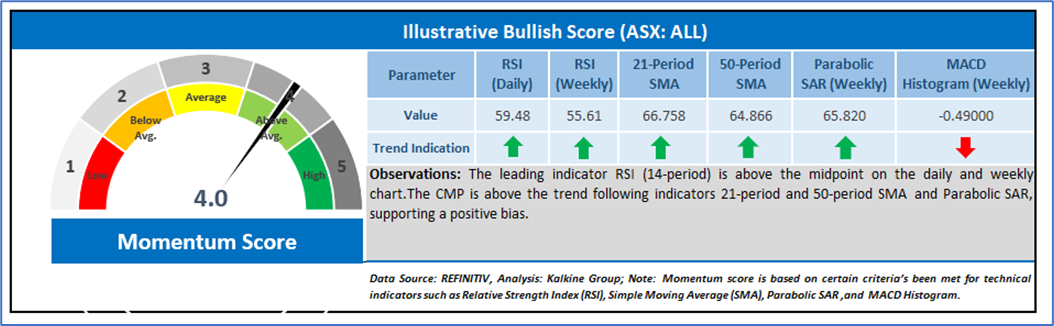
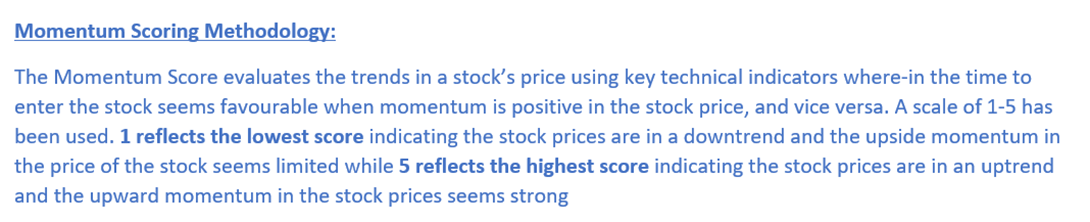
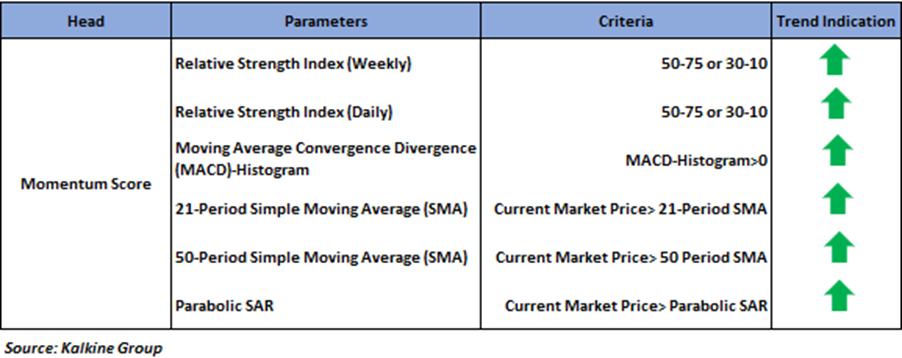
Company Overview: Aristocrat Leisure Ltd (ASX: ALL) is engaged in gaming technology and content. Headquartered in Sydney, Australia, the company designs, develops, and distributes innovative gaming machines, casino management systems, and digital social games. Aristocrat operates across more than 90 countries and serves both land-based and digital gaming markets. Report covers the Price Action, Technical Indicators Analysis along with the Target Levels, Stop Loss, and Recommendation on this stock. Noted below is the illustrative momentum score based on technical indicators for the stock:

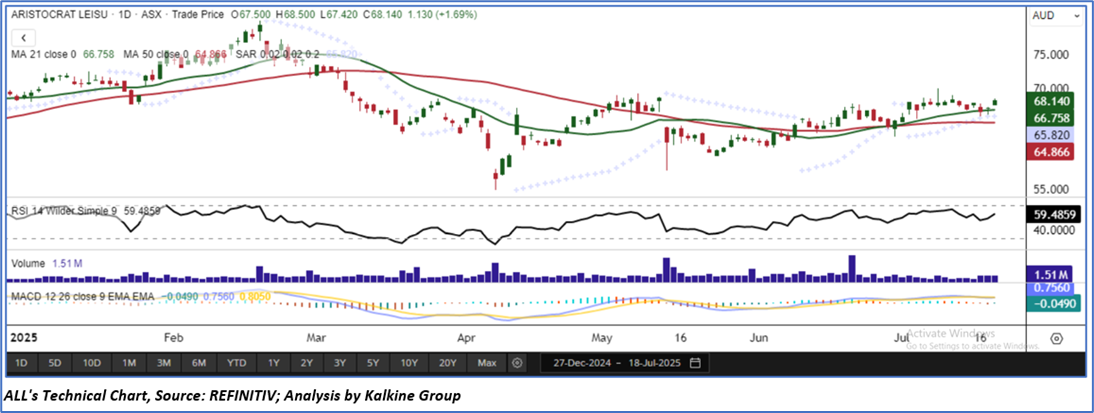
Technical Observation (on the Daily Chart)
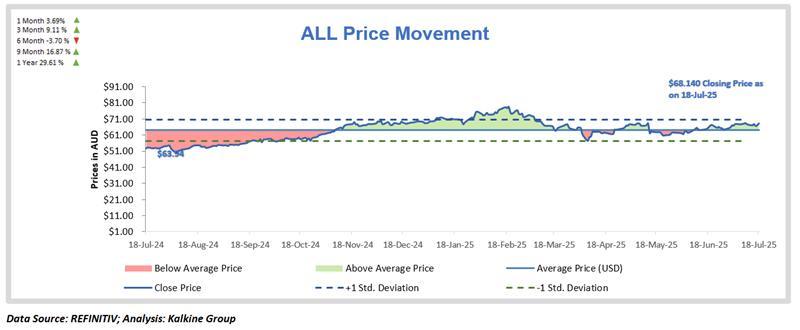
ALL's stock price found support at important levels and moved higher, pointing to the potential for a short-term rally. The Relative Strength Index (RSI) has been consistently climbing over the past 14 periods, reflecting growing momentum that is expected to persist. Moreover, the stock is trading above both its short-term and medium-term moving averages, confirming a solid support foundation for additional gains and increasing the chances of continued upward momentum.
Conclusion
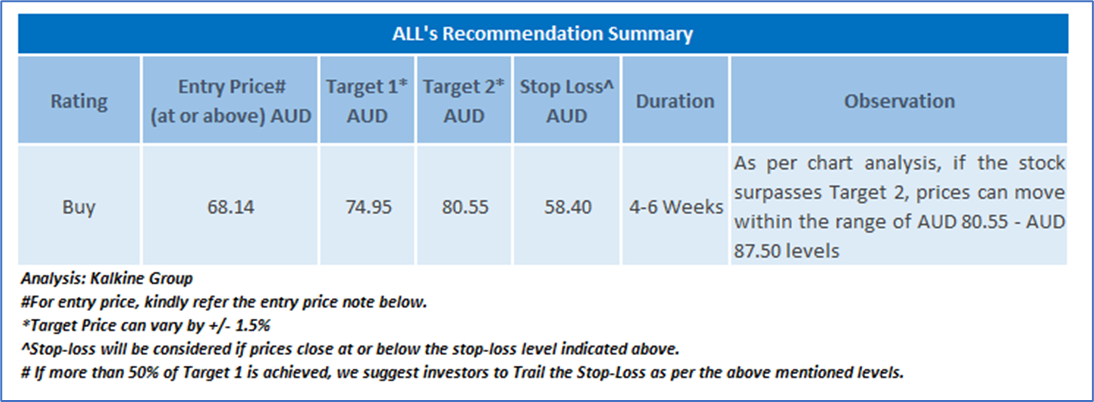
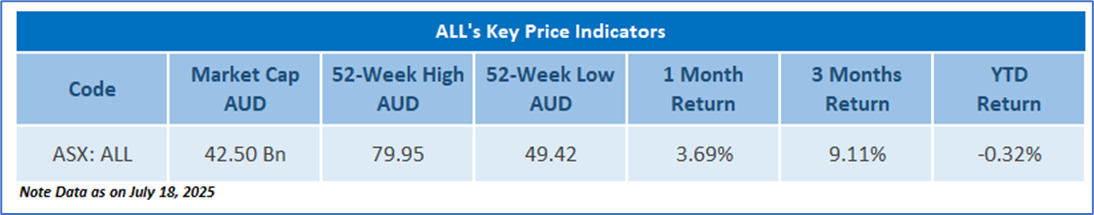
As per the above-mentioned price action and technical indicators analysis, a ‘Buy’ rating has been given on Aristocrat Leisure Ltd (ASX: ALL) at closing price of AUD 68.14 as on July 18, 2025.
Markets are trading in a highly volatile zone currently due to certain macro-economic issues and prevailing geopolitical tensions. Therefore, it is prudent to follow a cautious approach while making investment decisions.

Note 1: Past performance is not a reliable indicator of future performance.
Note 2: Investment decision should be made depending on an individual’s appetite for upside potential, risks, and any previous holdings. This recommendation is purely based on technical analysis, and fundamental analysis has not been considered in this report. Individuals can consider exiting from the stock if the Target Price or Stop loss mentioned as per the technical analysis has been achieved and subject to the factors discussed above.
Note 3: Related Risks: This report may be looked at from a high-risk perspective and recommendations are provided for a short duration. Recommendations provided in this report are solely based on technical parameters, and the fundamental performance of the stocks has not been considered in the decision-making process. Other factors which could impact the stock prices include market risks, regulatory risks, interest rates risks, currency risks, social and political instability risks etc.
Note 4: The holding duration for recommendations is 4-6 weeks; however, an extension of a further 2 weeks may be considered with an update report in case the opportunity looks technically well placed. The maximum holding duration is expected to be 8 weeks post which the position will be closed automatically in case no resistance, support and or stop loss levels are hit at the close price of the due date.
Note 5: How to Read the Charts?
The Green colour line reflects the 21-period moving average while the red line indicates the 50-period moving average. SMA helps to identify existing price trend. If the prices are trading above the 21-period and 50-period moving average, then it shows prices are currently trading in a bullish trend.
The Black colour line in the chart’s lower segment reflects the Relative Strength Index (14-Period) which indicates price momentum and signals momentum in trend. A reading of 70 or above suggests overbought status while a reading of 30 or below suggests an oversold status.
The Blue colour bars in the chart’s lower segment show the volume of the stock. The volume is the number of shares that changed hands during a given day. Stocks with high volumes are more liquid than stocks with lesser volume as liquidity in stocks helps with easier and faster execution of the order.
The Orange colour lines are the trend lines drawn by connecting two or more price points and used for trend identification purposes. The trend line also acts as a line of support and resistance.
Technical Indicators Defined: -
Stop-loss: In general, it is a level to protect further losses in case of unfavourable movement in the stock prices.
Parabolic SAR: Parabolic SAR is a trend-following indicator that acts as a trailing stop. If the price stops rising and reverses below SAR, it indicates the start of a downtrend with SAR above the price following like a trailing stop. Similarly, if the prices stop falling and move above SAR, it indicates the start of an uptrend with SAR below the price following like a trailing stop.
MACD-Histogram: Moving Average Convergence Divergence (MACD)-Histogram is the difference between the MACD and its signal line. A positive value of the MACD-Histogram indicates a positive crossover between MACD and its signal line, whereas a negative value indicates a negative crossover.
The reference date for all price data, currency, technical indicators, support, and resistance levels is July 18, 2025. The reference data in this report has been partly sourced from REFINITIV.
Abbreviations
CMP: Current Market Price
SMA: Simple Moving Average
AUD: Australian Dollar
RSI: Relative Strength Index
Note: Trading decisions require a thorough analysis by individuals. Technical reports in general chart out metrics that may be assessed by individuals before any stock evaluation. The above are illustrative analytical factors used for evaluating stocks; other parameters can be looked at along with additional risks per se. Past performance is neither an indicator nor a guarantee of future performance.
This report (“Report”) has been issued by Kalkine Pty Limited (ABN 34 154 808 312) (Australian financial services licence number 425376) (“Kalkine”) and prepared by Kalkine and its related bodies corporate who are authorised to provide general financial product advice. Kalkine.com.au and its associated pages are published by Kalkine.
Any advice provided in this Report is general advice only and does not take into account your objectives, financial situation or needs. You should therefore consider whether the advice is appropriate for your objectives, financial situation and needs before acting upon it.
There may be a Product Disclosure Statement, Information Memorandum or other offer document (“Offer Document”) for the securities or other financial products referred in this Report. You should obtain a copy of the relevant Offer Document and consider it before making any decision about whether to acquire the security or financial product.
Kalkine strongly recommends that you seek advice from a financial adviser, stockbroker or other professional (including taxation and legal advice) before acting on any of the general advice in this Report or on the Kalkine website. Not all investments are appropriate for all people.
The information in this Report and on the Kalkine website has been prepared from a wide variety of sources, which Kalkine, to the best of its knowledge and belief, considers accurate. Kalkine has made every effort to ensure the reliability of the information contained in its reports (including this Report), newsletters and websites. All information represents our views at the date of publication and may change without notice.
The information in this Report does not constitute an offer to sell securities or other financial products or a solicitation of an offer to buy securities or other financial products. Our reports contain general recommendations to invest in securities and other financial products. Kalkine is not responsible for, and does not guarantee, the performance of, or returns on, any investments mentioned in this Report.
Kalkine does not issue, sell or deal in any financial products.
This Report may contain information on past performance of particular investments. Past performance is not a reliable indicator of future performance. Returns stated do not take into account transaction costs and taxes. To the extent permitted by law, and excluding any dishonesty or gross negligence by Kalkine, Kalkine disclaims and excludes all liability for any direct, indirect, implied, punitive, special, incidental or other consequential loss or damage arising from the use of or reliance on this Report, the Kalkine website and any information published on the Kalkine website without any warranties or representations by Kalkine to you. To the extent the law prohibits or limits this exclusion, Kalkine limits its liability to the resupply of services.
Please also read our Terms & Conditions and Financial Services Guide for further information. Employees and/or associates of Kalkine and its related entities may hold interests in the securities or other financial products covered in this Report or on the Kalkine website. Any such employees and associates are required to comply with certain, procedures and disclosures as required by law.
Kalkine Media Pty Ltd, an affiliate of Kalkine Pty Ltd, may have received, or be entitled to receive, financial consideration in connection with providing information about certain entity(s) covered on its website including entities covered in this Report.
Copyright 2025 Krish Capital Pty. Ltd. (ABN 61629651510). All Rights Reserved. No part of this report, or its content, may be reproduced in any form without our prior consent.
Past performance is not a reliable indicator of future performance.
 Please wait processing your request...