Kalkine has a fully transformed New Avatar.

Company Overview: A.P. Eagers Limited is an automotive retail company. The Company's principal activities consist of the sale of new and used motor vehicles, distribution and sale of parts, accessories and car care products, repair and servicing of vehicles, provision of extended warranties, facilitation of finance and leasing in respect of motor vehicles, and the ownership of property and investments. Its Car Retail segment offers new and used vehicles, maintenance and repair services, vehicle parts, vehicle protection products and other aftermarket products; Truck Retail segment offers new and used trucks, truck maintenance and repair services, truck parts, extended service contracts, truck protection products and other aftermarket products; Property segment acquires commercial properties for use as facility premises for its motor dealership operations, and Investment segment includes the investment in One Way Traffic Pty Ltd, Automotive Holdings Group Limited and Smartgroup Corporation Limited.
.png)
APE Details
Growth Trajectory in Revenues Continuing at Decent Pace: AP Eagers Limited (ASX: APE) is a popular automotive retail company with the market capitalization of circa $1.27 Bn as of January 24, 2019. The company operates through four business segments i.e., (i) Car Retail, (ii) Truck Retail, (iii) Property (iv) Investments, which contributed revenue around 90%, 9%, 0.7%, and 0.3%, respectively of total revenue in CY17. Over the past five years, the company has been demonstrating uptrend in the revenues and the same have grown at CAGR of 11.0% during CY13-17 on the back of segmental mix growth. In 1HCY18, NPBT (net profit before tax) grew by 2.1% to $69.5 Mn over the prior corresponding period where it stood at $68.1 Mn. Moreover, for 1HCY18, the company delivered around 8.8% rise in the PAT to $53.7 Mn and 9.1% rise in the earnings per share (EPS) to 27.7 cents against the prior year. It witnessed favorable momentum in the trading performances with regards to Tasmania, Victoria as well as in its National Trucks division. In H1 CY 2018, on the YoY basis, the company encountered positive momentum with respect to the Queensland geography, however, the trading performance in its markets in the NSW (or New South Wales), as well as South Australia, were adversely impacted due to the unfavourable market conditions.
Under the tight economic conditions, the company has witnessed a rise in the net margins from 2.4% at the end of June 2017 to 2.6% at the end of June 2018 which reflects the strength of the company revenues as well as its disciplined cost management strategy. The company’s ROE has also witnessed an improvement from 6.5% at the June 2017 to 7.0% at the end of June 2018. At CMP of A$6.60, APE is trading at a PE of 13.95x CY19E earnings. Keeping the view of decent outlook in the business along with challenging market dynamics, we have valued the stock using the Relative valuation method and five-year average P/E of 15.4x for CY19E with consensus EPS of $0.47 and have arrived at target price upside of about single high digit (in %). Key Risk: subdued automobile sector, foreign exchange risk, interest rate risk, etc.
.png)
Financial Performance (Source: Company Reports, Thomson Reuters)
Consistently Distributed Growing Dividend Over the Decade: AP Eagers Limited has been declaring the dividends at the decent pace over the decade which might attract investors attention on the stock in years to come. The annual dividend yield of the company is about 4.2% on a four-year average basis (CY14-17). In CY14, the dividend payout ratio stood at 62.8% and finally, in CY17 the payout ratio came in at 71.6%. The company stated that its corporate debt, net of cash on hand, happens to be lesser as it was $214.1 million at the end of June 30, 2018 while at the end of December 31, 2017 it was $238.5 million on the back of the company’s robust operating cash generation. We expect that this capability of the company would continue to support APE moving forward. In CY17, the company declared fully franked dividend amounting to 36.0 cents per share, whereas in CY 2016, it declared 35.0 cents per share. The company’s annual dividend yield stood at 5.51% while the broader industry average happens to be 5.1% which implies that the company is well-above the industry average. We assume that the company will continue to reward its shareholders under regular circumstances along with decent dividend payout ratio in years to come.
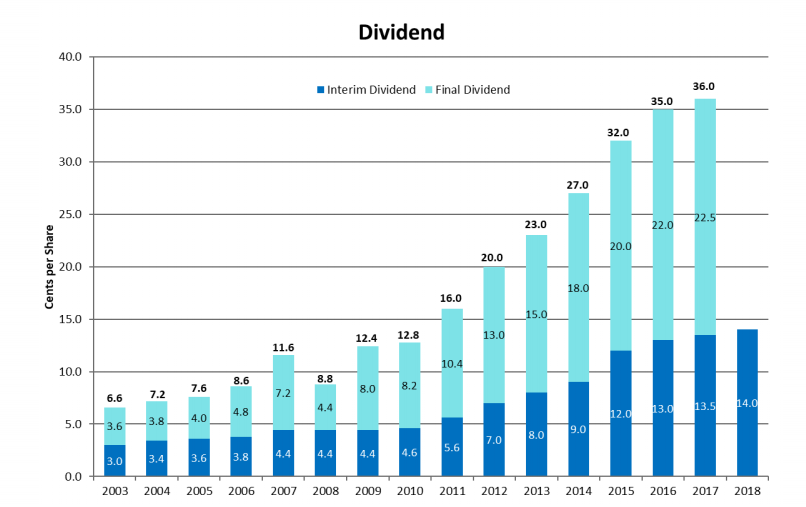
APE’s Dividends (Source: Company Reports)
Macro Environment Prevalent in Different Regions: As per Federal Chamber of Automotive Industry statistics, the sales of the new motor vehicles in the Australian region witnessed a rise of 1% in H1 CY 2018 on the YoY basis. The primary regions which have been supporting the national new vehicle sales were Victoria, Queensland as well as Western Australia. The sales in Queensland witnessed the rise of 2.7% on the YoY basis while the sales in Western Australia was up 4.1%. However, the sales in the Victoria region rose by 3.4% YoY. However, unfavourable momentum was witnessed in the New South Wales as well as Northern Territory. The sales in the NSW witnessed the decline of 2.7% while in Northern Territory the sales fell by 0.4% in H1 CY2018 on the YoY basis.
Robust Trading Supported Revenues: In H1 CY2018, AP Eagers Limited posted revenues of $2.09 billion while in the same period of the previous year, the revenues were $2.03 billion. However, on the like-for-like basis, the company’s revenues witnessed the rise of 3.2% YoY largely because of the robust trading encountered in Queensland as well as Victorian/Tasmanian car divisions as well as truck division. However, the impact got partially offset by the unfavourable momentum witnessed in NSW. Further, the company witnessed a rise in the borrowing costs from $12.39 million in H1 CY 2017 to $13.08 million in H1 CY 2018 because of the increased average bailment debt as well as increased interest rates. However, the impact of this got partially offset by the lesser hedging expenses.
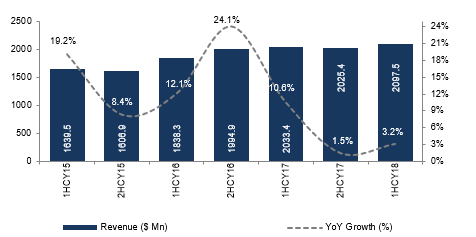
Results Summary (Source: Company Reports)
Business Segmental-Wise Performance: AP Eagers Limited’s Car Retail division posted profit before taxes amounting to $49.6 million in the H1 CY 2018 which implies the rise on the YoY basis as in 1H CY 2017, it was $45.3 million. The segment’s revenues were largely aided by robust trading with regards to Victoria/Tasmania as well as in Queensland. However, the impact got offset by the unfavourable momentum witnessed in NSW. AP Eagers Limited stated that national truck division posted profit before tax amounting to $5.2 million in H1 CY 2018 while in the same period of the previous year the figure stood at $3.7 million thanks to robust performance with regards to all the departments which also includes favorable results with respect to new truck and service divisions. This division’s revenues were supported by the positive truck market conditions.
The company stated that property portfolio’s value witnessed a fall and stood at $298 million at the end of June 30, 2018 while, at the end of December 31, 2017, it was $307 million. Because of the focus towards the management of the property portfolio, so that the financial, as well as operational outcomes, can be improved, the division witnessed divestment related to two properties during H1 CY 2018. AP Eagers Limited stated that investment division witnessed the pre-tax loss amounting to $59.5 million in H1 CY 2018 while in the same period of the previous year, the loss stood at $38.3 million. The rise was witnessed largely because of unrealized revaluation loss with regards to AHG investment.
What to Expect from APE in CY 2018: Recently, AP Eagers Limited had come forward and made an announcement related to the expected number for CY 2018. The company had stated that there are expectations that it would post a statutory net profit after tax amounting to $101.2 million in CY 2018 reflecting the rise of 3% on the YoY basis. There are expectations that its statutory net profit before tax would be $133.7 million in CY 2018 which implies the YoY fall of 1.4%. However, the expected statutory NPBT happens to surpass profit guidance range which was given by the company.
The company stated that this improvement compared to the guidance is expected because of the robust operating net profit before tax with regards to the truck and car retailing businesses. These businesses witnessed strong operating results in the December 2018 month. Moreover, as demonstrated by the company’s H1 CY 2018 results presentation, there are expectations that the company might implement new RBP (or Risk-Based Pricing) finance models from its numerous financiers. The company stated that it would be carrying out the activities which are focused towards reorganizing as well as redeveloping the inner-City Brisbane facilities so that the stakeholders can be benefitted.
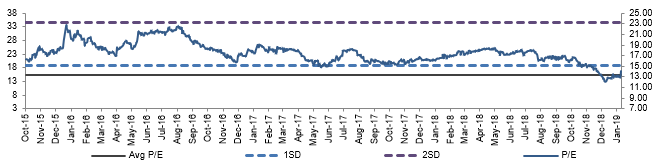
Historical P/E Band (Source: Company Reports)
Stock Recommendation and Outlook: In last six months, the stock has fallen 22.91% and is trading at reasonable PE multiple of 12.6x, indicating undervalued scenario at current juncture. On the daily chart of AP Eagers Limited, Moving Average Convergence Divergence or MACD has been applied and default values were used for the consideration. After the careful consideration, it was noticed that the MACD line has crossed the signal line and is trending in the upward direction signifying the bullish momentum. Moreover, the Exponential Moving Average or EMA was also applied and default values were used here as well. It was observed that the stock price has crossed the EMA and trended upwards after the crossover reflecting that the stock might witness bullish momentum. Moreover, the market players might also get attracted by the decent rise in the dividends as well as by the expectations that the company might outpace its profit guidance range for CY18. Further, the company had stated that though the present dynamics of the markets happen to be challenging, the industry is encountering transition and the company might reap the benefits. On the other hand, the company has strong relationships with vehicle manufacturers and dealers within the market which ensure growth momentum moving ahead. At CMP of A$6.60, APE is trading at a PE of 13.95x CY19E earnings. Keeping the view of decent outlook in the business along with challenging market dynamics, we have valued the stock using the Relative valuation method and five-year average P/E of 15.4x for CY19E with consensus EPS of $0.47 and have arrived at target price upside of about single high digit (in %). Given the backdrop of aforesaid factors, we give a “Buy” recommendation on the stock at the current market price of A$6.60 per share (down 0.452% on January 24, 2019).
.png)
APE Daily Chart (Source: Thomson Reuters)
Disclaimer
The advice given by Kalkine Pty Ltd and provided on this website is general information only and it does not take into account your investment objectives, financial situation or needs. You should therefore consider whether the advice is appropriate to your investment objectives, financial situation and needs before acting upon it. You should seek advice from a financial adviser, stockbroker or other professional (including taxation and legal advice) as necessary before acting on any advice. Not all investments are appropriate for all people. Kalkine.com.au and associated pages are published by Kalkine Pty Ltd ABN 34 154 808 312 (Australian Financial Services License Number 425376). The information on this website has been prepared from a wide variety of sources, which Kalkine Pty Ltd, to the best of its knowledge and belief, considers accurate. You should make your own enquiries about any investments and we strongly suggest you seek advice before acting upon any recommendation. Kalkine Pty Ltd has made every effort to ensure the reliability of information contained in its newsletters and websites. All information represents our views at the date of publication and may change without notice. To the extent permitted by law, Kalkine Pty Ltd excludes all liability for any loss or damage arising from the use of this website and any information published (including any indirect or consequential loss, any data loss or data corruption). If the law prohibits this exclusion, Kalkine Pty Ltd hereby limits its liability, to the extent permitted by law to the resupply of services. There may be a product disclosure statement or other offer document for the securities and financial products we write about in Kalkine Reports. You should obtain a copy of the product disclosure statement or offer document before making any decision about whether to acquire the security or product. The link to our Terms & Conditions has been provided please go through them and also have a read of the Financial Services Guide. On the date of publishing this report (mentioned on the website), employees and/or associates of Kalkine Pty Ltd do not hold positions in any of the stocks covered on the website. These stocks can change any time and readers of the reports should not consider these stocks as personalised advice.
Past performance is not a reliable indicator of future performance.
 Please wait processing your request...