Kalkine has a fully transformed New Avatar.

Company Overview: Alphabet Inc. is a holding company. The Company's businesses include Google Inc. (Google) and its Internet products, such as Access, Calico, CapitalG, GV, Nest, Verily, Waymo and X. The Company's segments include Google and Other Bets. The Google segment includes its Internet products, such as Search, Ads, Commerce, Maps, YouTube, Google Cloud, Android, Chrome and Google Play, as well as its hardware initiatives. The Google segment is engaged in advertising, sales of digital content, applications and cloud offerings, and sales of hardware products. The Other Bets segment is engaged in the sales of Internet and television services through Google Fiber, sales of Nest products and services, and licensing and research and development (R&D) services through Verily. It offers Google Assistant, which allows users to type or talk with Google; Google Maps, which helps users navigate to a store, and Google Photos, which helps users store and organize all of their photos..png)
GOOGL Details
Alphabet Inc’s (NASDAQ: GOOGL) seems to be gaining traction once again, given the continued strength in mobile search, YouTube, Google Play and Ad Tech. Support from share buyback and disciplined tone on expense management are other catalysts that are expected to pave path for continued growth trajectory.
Google Cloud platform is rapidly growing: Alphabet’s Google Cloud comprises Google Cloud Platform and G Suite, and as per the reported data for the twelve months ended December 2017, Google Cloud is the fastest growing major public cloud provider in the world. Google Cloud continues to grow while the group is making more strategic deals with customers. The number of deals worth over $1 million across all Cloud products more than tripled from 2016 to 2017. During the fourth quarter of 2017, the group strengthened partnerships with industry leaders including Cisco for open hybrid environments, Salesforce for customer insights and productivity, and SAP for AI and data insights across their products. These collaborations relate to several activities from engineering integration to marketing programs to joint sales, and they even entail Google Cloud Platform, G Suite, and Google Analytics. The group added major global brands like Bed, Bath & Beyond, Dentsu Aegis Network, Keller Williams, Mattel and Tyco Retail Solutions. The group exceeded 4 million paying customers on G Suite.
.png)
Consolidated Result (Source: Company Reports)
Financial performance: For 2017, the overall revenues rose 23% year on year (yoy) to $110.9 billion against 2016, while operating income enhanced 22% yoy to $28.9 billion, excluding the European Commission fine. The group’s revenues rose 24% yoy to $32.3 billion during the fourth quarter of 2017 driven by ongoing solid performance in Sites revenue. The group also witnessed a healthy growth in Network revenues driven by their programmatic business and AdMob wherein the segment revenues rose 13% yoy to $5.0 billion. Other Revenue segments which include Hardware, Cloud and Play, also performed well. As per the Google segment, the revenues rose 24% yoy to $31.9 billion, while Google Sites revenues were $22.2 billion in the quarter, which is a rise of 24% on a year-over-year basis, led again by mobile search, complemented by solid growth from desktop search and strong performance from YouTube. Other Revenues for Google were $4.7 billion, rising 38% year-over-year, fueled by Hardware, Cloud and Play.
.png)
Segment-wise revenue (Source: Company reports)
Rising costs: The total traffic acquisition costs (TAC) reached $6.5 billion, or 24% of total advertising revenues, which is a rise of 33% on a year-over-year basis as their strongest growth areas mobile search and programmatic carry a higher TAC. The rise in the Sites TAC rate on a year-over-year basis was boosted by changes in partner agreements and the ongoing shift to mobile, which carries a higher TAC because more mobile searches are channeled through paid access points. The underlying trend affecting the Network TAC rate year-over-year continues to be the shift to programmatic, which carries a higher TAC. Google stock-based compensation reached $1.7 billion for the year which is a rise of 1% on a year-over-year basis. The Operating income rose 11% yoy to $8.8 billion, while the operating margin reached 27%. The cash capex reached $4.3 billion during the quarter while the operating cash flow was $10.3 billion with free cash flow of $6.0 billion. The group has a cash and marketable securities of over $102 billion as at end of the quarter.
YouTube highlights: YouTube has more than 1.5 billion people every month watching their favorite content on channels ranging from the Ellen Show, which has more than 22 million subscribers, to the NBA with over 8 million subscribers, to SciShow, a popular educational channel, with more than 4.5 million subscribers. There are over one billion learning-related video views every day on YouTube. YouTube has become a major part of their TV viewing experience. YouTube made a partnership with Major League Soccer’s LA Football Club. YouTube TV would be the exclusive home to watch all locally televised English-language matches, while YouTube TV is currently available on Roku. The group is expanding the popular YouTube Go app to over 130 countries around the globe. During the fourth quarter, they strengthened their relationship with the music industry, signing new licensing deals with Sony Music Entertainment and Universal Music Group.
Growing hardware business: Google hardware products performed well during the holiday season with device shipments being more than double on a year-over-year basis during the fourth quarter of 2017. Google devices are gaining traction at home, like the Google Home, Mini, Max, and Chromecast. The group even made a deal with HTC, to drive innovation for the coming years. Google Assistant is also gaining importance which is now available on more than 400 million devices, including speakers like Google Home, as well as Android phones and tablets, iPhones, headphones, televisions, watches and more. The group brought the Assistant to new surfaces, like smart displays from brands like JBL and Lenovo, as well as Android Auto, which is currently available in more than 400 car models from brands like GM, Hyundai and Volvo.
Other AI efforts: Photography has been benefitting from the advancements in Artificial Intelligence. In this parlance, the Pixel 2 phone is a leader in video rankings by industry standards, with smoother and clearer videos driven by the group’s machine learning and their video stabilization technique. Google Photos continue to go strong which saw over three billion photos and videos on New Year’s Eve alone. The group recently gave Google Cloud customers access to AutoML, which makes it far easier to build complex neural nets and more than 10,000 customers have already signed up to try it. The group forecasts Go devices from dozens of manufacturers, and with great support from mobile operators and app developers around the world. Google Play is also growing well. The group also launched Audiobooks to enable users to access books from multiple devices. In Latin America, the number of unique monthly buyers on Google Play rose over 50% year-over-year in 2017. Chromebooks also continued to gain momentum and traction. Fourth quarter sales of consumer Chromebooks in the US have been said to rise over 70% year-over-year.
Outlook: The group is making investments for the next leg of growth with Google Cloud, Hardware and YouTube, and their machine learning efforts that are powering innovation across businesses. The group continues to support their priority areas by enhancing headcount, which would remain concentrated in R&D. They added 2,000 employees to support their Hardware business post the deal with HTC. With respect to SBC (stock-based compensation), they finished the transition to a single annual compensation cycle for employees, with a full-year equity refresh grant to employees in the first quarter of 2018. The biannual grant to SVPs would also occur in the first quarter. In 2018, the group continued to calibrate the magnitude and pace of investment appropriate to their individual execution paths. The group has also become the biggest corporate buyer of renewable power in the US for catering to the power needs of all its data centres and global operations.
.png)
Paid Clicks and Cost per Click (Source: Company Reports)
Stock performance: The shares of GOOGL have been under pressure this year to date and have fallen about 3.5% at the back of volatile market conditions with fears looming from potential trade war with China and recent challenges faced by Facebook. On the other hand, the group is a clear market leader and continues to make major investments in three biggest bets -- Cloud, YouTube and Hardware. GOOGL believes that these bets promise a solid potential and are showing real momentum and gaining traction. Further, the aggregate paid clicks continue to show growth, which rose 18% in fourth quarter of 2017 against last quarter and 43% as compared to the pcp. Moreover, management approved another $8,589,869,056 of its Class C capital stock repurchase. GOOGL stock rose over 20.8% in the last one year and we believe the bullish momentum would continue on a long-term basis despite volatility. While the latest financial performance, recent dip in stock price and legal battle with Oracle Corporation can be looked differently, the group has strong fundamentals with steady increase in revenue and return on invested capital to provide value to shareholders. The stock price, which may look high, is still at a discounted level in view of the historical trends and given the long-term potential. Accordingly, we give a “Buy” recommendation on the stock at the current price of $1,029.71, ahead of the financial results for the first quarter of 2018 to be reported on April 23, 2018.
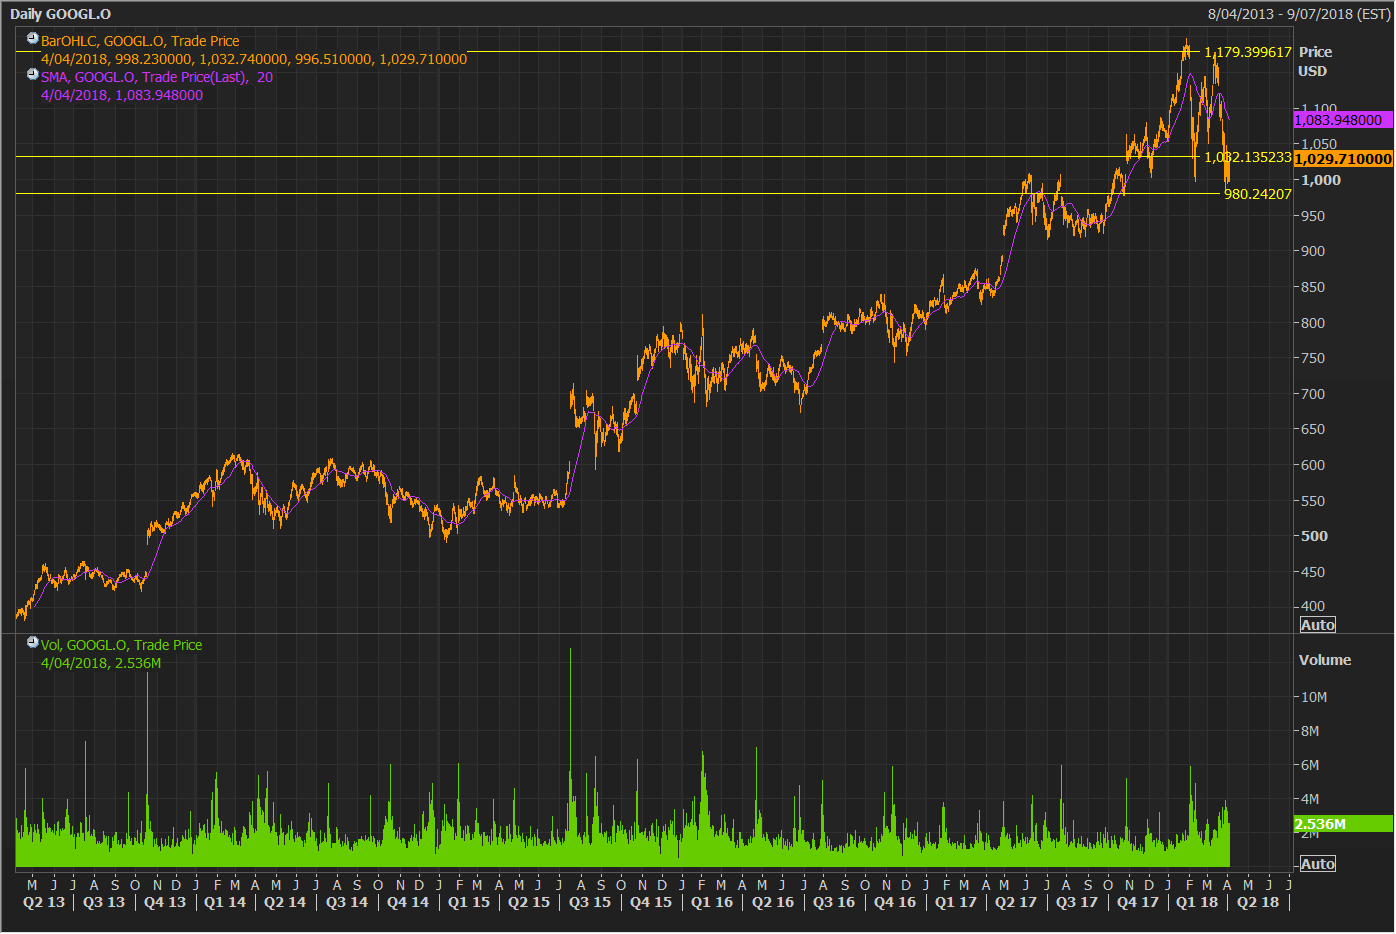
GOOGL Daily Chart (Source: Thomson Reuters)
Disclaimer
The advice given by Kalkine Pty Ltd and provided on this website is general information only and it does not take into account your investment objectives, financial situation or needs. You should therefore consider whether the advice is appropriate to your investment objectives, financial situation and needs before acting upon it. You should seek advice from a financial adviser, stockbroker or other professional (including taxation and legal advice) as necessary before acting on any advice. Not all investments are appropriate for all people. Kalkine.com.au and associated pages are published by Kalkine Pty Ltd ABN 34 154 808 312 (Australian Financial Services License Number 425376). The information on this website has been prepared from a wide variety of sources, which Kalkine Pty Ltd, to the best of its knowledge and belief, considers accurate. You should make your own enquiries about any investments and we strongly suggest you seek advice before acting upon any recommendation. Kalkine Pty Ltd has made every effort to ensure the reliability of information contained in its newsletters and websites. All information represents our views at the date of publication and may change without notice. To the extent permitted by law, Kalkine Pty Ltd excludes all liability for any loss or damage arising from the use of this website and any information published (including any indirect or consequential loss, any data loss or data corruption). If the law prohibits this exclusion, Kalkine Pty Ltd hereby limits its liability, to the extent permitted by law to the resupply of services. There may be a product disclosure statement or other offer document for the securities and financial products we write about in Kalkine Reports. You should obtain a copy of the product disclosure statement or offer document before making any decision about whether to acquire the security or product. The link to our Terms & Conditions has been provided please go through them and also have a read of the Financial Services Guide. On the date of publishing this report (mentioned on the website), employees and/or associates of Kalkine Pty Ltd do not hold positions in any of the stocks covered on the website. These stocks can change any time and readers of the reports should not consider these stocks as advice or recommendations.
 Please wait processing your request...