Kalkine has a fully transformed New Avatar.


Kalkine’s Global Tariff Report delivers objective, data-driven insights into key global sectors impacted by tariff fluctuations. It assesses how these changes influence equity valuations across affected industries, with a focus on trade-sensitive sectors that often attract increased investor attention during times of tariff-related uncertainty. The report also highlights defensive and countercyclical segments that tend to show resilience—or even outperformance—amid disruptions in global trade dynamics.
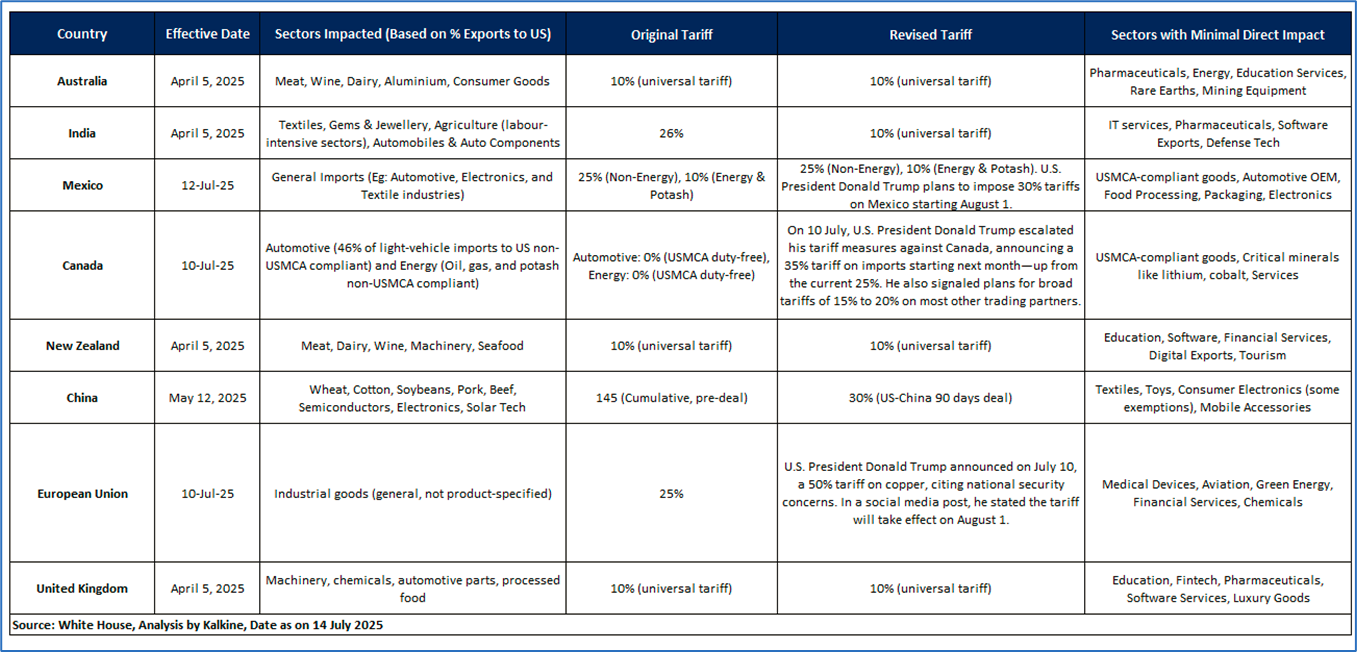
As illustrated in the table below, several key sectors in different countries are directly impacted by the recent tariff announcement from President Trump.
Xxxxxx Xxxxxx Xxxxxx
Xxxxxx Xxxxxx
Xxxxxx Xxxxxx Xxxxxx Xxxxxx Xxxxxx Xxxxxx Xxxxxx Xxxxxx Xxxxxx Xxxxxx Xxxxxx Xxxxxx Xxxxxx Xxxxxx Xxxxxx Xxxxxx Xxxxxx Xxxxxx Xxxxxx Xxxxxx Xxxxxx Xxxxxx Xxxxxx Xxxxxx Xxxxxx Xxxxxx Xxxxxx Xxxxxx .
Xxxxxx Xxxxxx Xxxxxx Xxxxxx & Xxxxxx
Xxxxxx Xxxxxx
Xxxxxx Xxxxxx Xxxxxx Xxxxxx Xxxxxx Xxxxxx Xxxxxx Xxxxxx Xxxxxx Xxxxxx Xxxxxx Xxxxxx Xxxxxx Xxxxxx Xxxxxx Xxxxxx Xxxxxx Xxxxxx Xxxxxx Xxxxxx Xxxxxx Xxxxxx Xxxxxx Xxxxxx .
Xxxxxx
Xxxxxx Xxxxxx Xxxxxx Xxxxxx Xxxxxx Xxxxxx Xxxxxx Xxxxxx Xxxxxx Xxxxxx Xxxxxx Xxxxxx Xxxxxx Xxxxxx Xxxxxx Xxxxxx Xxxxxx Xxxxxx Xxxxxx Xxxxxx Xxxxxx Xxxxxx Xxxxxx Xxxxxx Xxxxxx Xxxxxx Xxxxxx Xxxxxx Xxxxxx Xxxxxx Xxxxxx Xxxxxx Xxxxxx Xxxxxx Xxxxxx Xxxxxx Xxxxxx Xxxxxx Xxxxxx Xxxxxx Xxxxxx Xxxxxx Xxxxxx Xxxxxx .
Enter your details below and our team will help you to decide if this product is best for you.
This report (“Report”) has been issued by Kalkine Pty Limited (ABN 34 154 808 312) (Australian financial services licence number 425376) (“Kalkine”) and prepared by Kalkine and its related bodies corporate who are authorised to provide general financial product advice. Kalkine.com.au and its associated pages are published by Kalkine.
Any advice provided in this Report is general advice only and does not take into account your objectives, financial situation or needs. You should therefore consider whether the advice is appropriate for your objectives, financial situation and needs before acting upon it.
There may be a Product Disclosure Statement, Information Memorandum or other offer document (“Offer Document”) for the securities or other financial products referred in this Report. You should obtain a copy of the relevant Offer Document and consider it before making any decision about whether to acquire the security or financial product.
Kalkine strongly recommends that you seek advice from a financial adviser, stockbroker or other professional (including taxation and legal advice) before acting on any of the general advice in this Report or on the Kalkine website. Not all investments are appropriate for all people.
The information in this Report and on the Kalkine website has been prepared from a wide variety of sources, which Kalkine, to the best of its knowledge and belief, considers accurate. Kalkine has made every effort to ensure the reliability of the information contained in its reports (including this Report), newsletters and websites. All information represents our views at the date of publication and may change without notice.
The information in this Report does not constitute an offer to sell securities or other financial products or a solicitation of an offer to buy securities or other financial products. Our reports contain general recommendations to invest in securities and other financial products. Kalkine is not responsible for, and does not guarantee, the performance of, or returns on, any investments mentioned in this Report.
Kalkine does not issue, sell or deal in any financial products.
This Report may contain information on past performance of particular investments. Past performance is not a reliable indicator of future performance. Returns stated do not take into account transaction costs and taxes. To the extent permitted by law, and excluding any dishonesty or gross negligence by Kalkine, Kalkine disclaims and excludes all liability for any direct, indirect, implied, punitive, special, incidental or other consequential loss or damage arising from the use of or reliance on this Report, the Kalkine website and any information published on the Kalkine website without any warranties or representations by Kalkine to you. To the extent the law prohibits or limits this exclusion, Kalkine limits its liability to the resupply of services.
Please also read our Terms & Conditions and Financial Services Guide for further information. Employees and/or associates of Kalkine and its related entities may hold interests in the securities or other financial products covered in this Report or on the Kalkine website. Any such employees and associates are required to comply with certain, procedures and disclosures as required by law.
Kalkine Media Pty Ltd, an affiliate of Kalkine Pty Ltd, may have received, or be entitled to receive, financial consideration in connection with providing information about certain entity(s) covered on its website including entities covered in this Report.
Copyright 2025 Krish Capital Pty. Ltd. (ABN 61629651510). All Rights Reserved. No part of this report, or its content, may be reproduced in any form without our prior consent.
 Please wait processing your request...