Kalkine has a fully transformed New Avatar.

Overview: A technology-based company, Afterpay Limited (ASX: APT) is involved in making purchasing feel boundless for customers on a global basis. The company’s pay later business aids retailers to offer their customers with facility to buy now and pay later without demanding interests, credit or any upfront fees. Presently, the company has around 4.3 million active customers, with ~30,600 and more active retail merchants on-boarded. The company operates in Australia and overseas, which consists of advanced digital payment businesses servicing in telecommunications, health and convenience retail sectors.
.png)
APT Details
Targeting to Boost Revenue through an Expanded Customer Base: Afterpay Limited (ASX: APT) is engaged in providing technology-driven payments solutions for businesses and consumers through its Afterpay and Pay Now services and businesses. The Company mainly focuses on utilizing its technology to offer retail payments services that enable commerce between end customers & retail merchants, offering them ‘buy now, receive now, pay later’ services. APT has three operating business units namely mobility and payments, health and government and retail services.
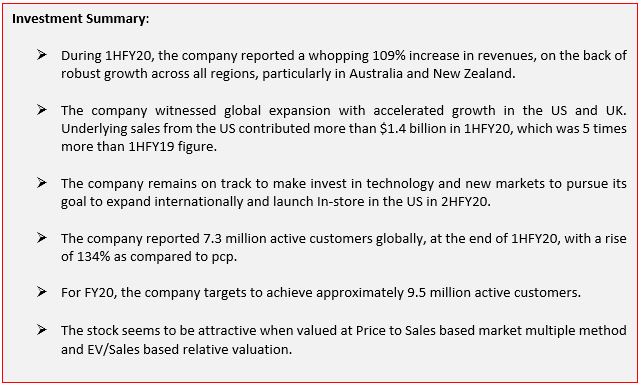
Global underlying sales for the half year ended 31 December 2019 amounted to $4.8 billion, representing an increase of 109% on the prior corresponding period. The period was marked by high run rate of over $11 billion/annum. The increase in underlying sales was witnessed through robust growth across all regions. Growth in both online and In-store channels in Australia and New Zealand aided the results. Further, global expansion with accelerated growth particularly in the US and UK were key positives. US underlying sales contributed more than $1.4 billion in 1HFY20, which was 5 times more than 1HFY19 figure. Loss after tax for the period came in at $31.6 million as compared to a loss of $22.2 million in 1HFY19. Bottom-line was affected due to the inclusion of one-time share-based payment expenses relating to the accounting standards. EBITDA, excluding significant items, came in at $6.8 million, down 51% from previous corresponding year. The business witnessed a robust growth across the geographies of Australia and New Zealand, with in-store growing strongly and representing ~24% of total ANZ underlying sales.
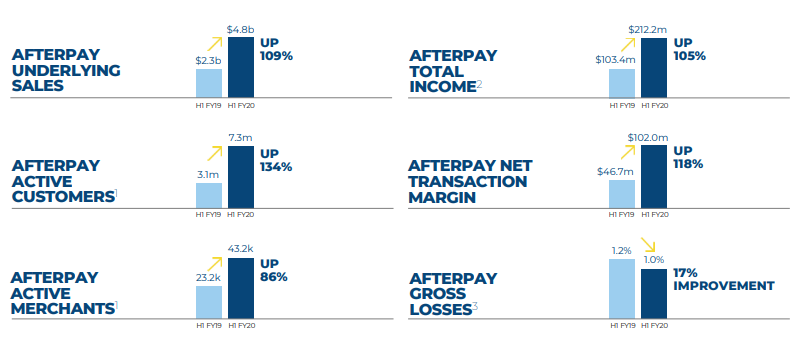
The company continues to invest in developing new markets, with an ambition to exceed its mid-term targets. The company expects growing opportunities in the United States and United Kingdom markets, with significant ability to accelerate its online offering and develop into new channels and verticals. It continues to assess further opportunities for international expansion. Moreover, the company reported 7.3 million active customers globally, at the end of 1HFY20, with a rise of 134% as compared to pcp.
.png)
ANZ Customer Frequency Graph (Source Company Reports)
1HFY20 Financial and Operational Highlights: During the half year ended 31st December 2019, the company witnessed continuous growth in its underlying sales, which soared a whopping 109%, owing to accelerated growth in the US and UK. The company’s in-store offering in Australia and New Zealand continues to witness growth, with an additional 14.2k store fronts as compared to H1FY19. During the period the company witnessed 86% rise in its global active merchants, on the back of robust increase in all markets. As a percentage of underlying sales, net transaction margin stood at 2.1%. The company remains on track to make investments in technology and new markets to pursue its goal to expand internationally and launch In-store in the US in 2HFY20.
In 1HFY20, total Group income stood at $220.3 million, an increase of 96% year over year, whereas total Afterpay income increased 105% year over year and came in at $212.2 million in 1HFY20. Merchant margins for 1HFY20 stood at 3.8%, as compared to 3.7% in H1FY19, depicting the company’s strong business model. The company witnessed a gross loss as a percentage of underlying sales of 1%, down from 1.2% in H1FY19. Afterpay’s net transaction margin increased 118% to $102 million. EBITDA (excluding significant items) increased a whopping 51% year over year in 1HFY20, driven by a higher investment in marketing, people and technology. The company aims to accelerate growth in existing markets to expand its geographic footprint and product development.
1HFY20 Key Highlights (Source: Company Reports)
Growth in Customers a Key Catalysts: Active customers stood at 7.3 million globally, averaging more than 16,800 new customers/day in 1HFY20 and rising to more than 22,900 per day in November and December 2019. The robust growth in customers utilizing the Afterpay service was aided by a burst of speed in US active customers to 3.6 million at the end of 31 December 2019, up from 0.7 million in the prior corresponding period. The Australia and New Zealand businesses continued to attract more customers, increasing by 0.6 million in 1HFY20. The UK business acquired 0.6 million customers by the end of the period. Number of active customers purchasing frequency continued to grow across all markets.
Active Customers & Merchants (Source: Company Reports)
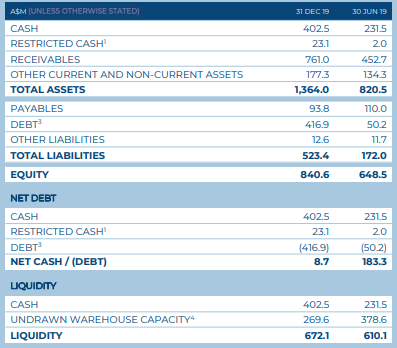
Balance Sheet & Cash Flow Position: The company exited the period, with cash and cash equivalents of $402.5 million. Net cash outflow from operating activities for the period came in at $342.1 million as compared to net cash outflow of $159.9 million in the year-ago period. Total debt increased to $416.9 million as at 31 December 2019 from $50.2 million at 30 June 2019, as APT withdrew its warehouse receivables facilities to fund underlying sales growth.
Balance Sheet (Source: Company Reports)
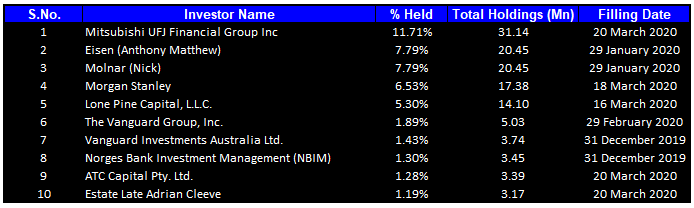
Shareholder Update: In a recent announcement, the company updated that Mitsubishi UFJ Financial Group, Inc., a substantial shareholder, has increased its voting power of fully paid ordinary shares from 8.86% to 11.71%.
Top 10 Shareholders: The top 10 shareholders have been highlighted in the table which together form around 46.21% of the total shareholding. Mitsubishi UFJ Financial Group Inc held the maximum number of shares with a percentage holding of 11.71%, followed by Eisen (Anthony Matthew) holding 7.79% of the shares.
Top Ten Shareholders (Source: Thomson Reuters)
Key Metrics: For 1HFY20, the company reported gross margin at 74.8%, which was in line with the industry median. Current ratio in 1HFY20 stood at 11.03x, higher than the industry median of 2.26x. Current ratio for 1HFY20 was also higher than the Jun’ 19 and Dec’19 figure of 5.78x and 7.8x, respectively. The company reported debt to equity multiple at 0.50x in 1HFY20, lower than the Dec’19 figure of 0.54x, reflecting a stable financial position.
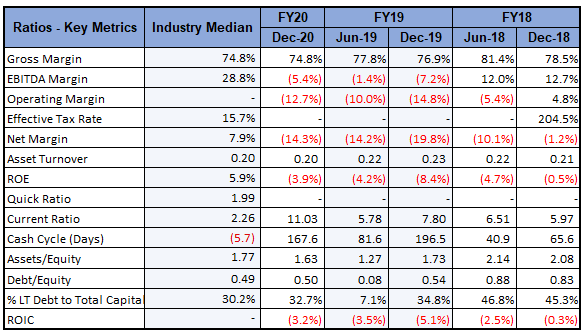
Key Metrics (Source: Thomson Reuters)
Outlook: The company targets to achieve approximately 9.5 million active customers by the end of FY20. The company remains on track to invest in people, with particular focus on sales, product and technology to exceed its previously declared mid-term target of ~$20 billion by the end of FY22. Further, the company remains focused on expanding its flagship technology through innovation and acquisitions, enabling better business operations across the world. Higher investment in existing market acceleration as well as global expansion to launch In-store in the US in second half of FY20 remains a key focus area. Further, the company targets Canada as its next market in 2020.
To conclude, the company’s right strategy, the right people and the right business model will eventually help it deliver long term value for its shareholders.
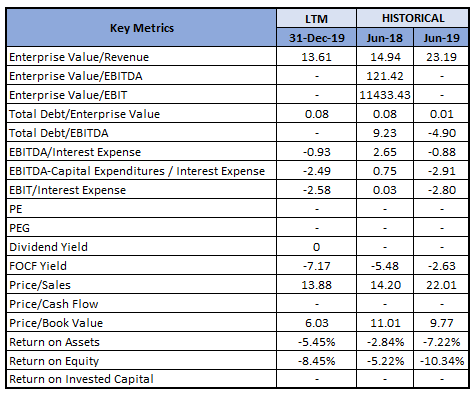
Key Valuation Metrics (Source: Thomson Reuters)
Valuation Methodologies:
Method 1: Price to Sales Based Market Multiple Method(23).png)
Price to Sales Based Market Multiple Method (Source: Thomson Reuters)
Method 2: EV/Sales Based Relative Valuation Method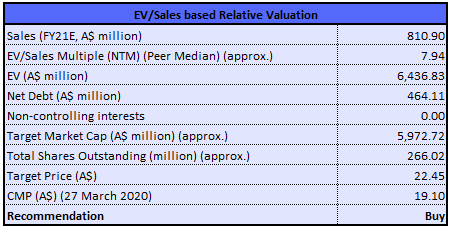
EV/Sales Based Relative Valuation Method (Source: Thomson Reuters)
Note: All forecasted figures and peers have been taken from Thomson Reuters, NTM-Next Twelve Months
Stock Recommendation: The stock of the company has corrected by 45.35% in the last six months and is currently trading below the average of its 52-week trading range of $8.010 - $41.140. As on 27 March 2020, the market capitalization of the company stood at $5.16 billion, with outstanding shares of ~266.02 million. Despite the outbreak of Coronavirus, the Company witnessed stellar growth across all channels and geographies. The Management highlighted that growth in the U.S. and the UK came in higher than their estimates, owing to the on-boarding of new major merchant brands. The Company reported underlying sales of more than $1 billion across the U.S., in 1HFY20. The company would be utilising these proceeds for global platform expansion opportunities beyond mid-term plan deliverables. We have valued the stock using a price-to-sales based market multiple approach and EV/Sales based relative valuation method and arrived at a target price of lower double-digit growth (in percentage terms). Hence, considering the above supporting factors and the steep correction in the stock price, we give a “Buy” rating on the stock at the current market price of $19.1 per share, down by 1.597% on 27 March 2020.
.png)
APT Daily Technical Chart (Source: Thomson Reuters)
Disclaimer
The advice given by Kalkine Pty Ltd and provided on this website is general information only and it does not take into account your investment objectives, financial situation or needs. You should therefore consider whether the advice is appropriate to your investment objectives, financial situation and needs before acting upon it. You should seek advice from a financial adviser, stockbroker or other professional (including taxation and legal advice) as necessary before acting on any advice. Not all investments are appropriate for all people. Kalkine.com.au and associated pages are published by Kalkine Pty Ltd ABN 34 154 808 312 (Australian Financial Services License Number 425376). The information on this website has been prepared from a wide variety of sources, which Kalkine Pty Ltd, to the best of its knowledge and belief, considers accurate. You should make your own enquiries about any investments and we strongly suggest you seek advice before acting upon any recommendation. Kalkine Pty Ltd has made every effort to ensure the reliability of information contained in its newsletters and websites. All information represents our views at the date of publication and may change without notice. To the extent permitted by law, Kalkine Pty Ltd excludes all liability for any loss or damage arising from the use of this website and any information published (including any indirect or consequential loss, any data loss or data corruption). If the law prohibits this exclusion, Kalkine Pty Ltd hereby limits its liability, to the extent permitted by law to the resupply of services. There may be a product disclosure statement or other offer document for the securities and financial products we write about in Kalkine Reports. You should obtain a copy of the product disclosure statement or offer document before making any decision about whether to acquire the security or product. The link to our Terms & Conditions has been provided please go through them and also have a read of the Financial Services Guide. On the date of publishing this report (mentioned on the website), employees and/or associates of Kalkine Pty Ltd do not hold positions in any of the stocks covered on the website. These stocks can change any time and readers of the reports should not consider these stocks as personalised advice.
Past performance is not a reliable indicator of future performance.
 Please wait processing your request...