

Kalkine's Global Tariff Report offers independent, data-driven analysis of key global sectors impacted by tariff adjustments. It evaluates the potential implications these changes may have for equity valuations within those industries. The report prioritizes trade-sensitive sectors, which typically face increased investor scrutiny during periods of tariff uncertainty, while also identifying defensive and countercyclical segments that demonstrate resilience or potential for outperformance amidst global trade disruptions.
As illustrated in the table below, several key sectors in different countries are directly impacted by the recent tariff announcement from President Trump.
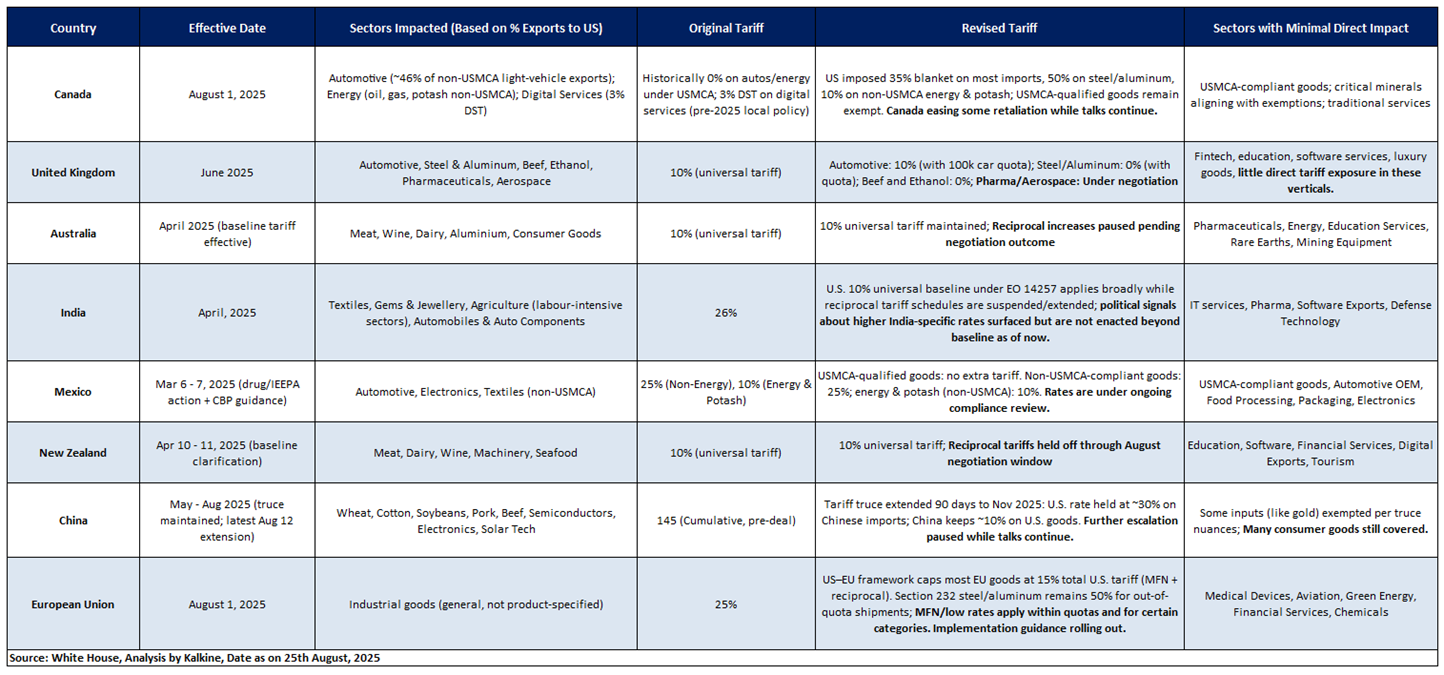

Key Developments (as of August 25th, 2025)
Canada
India
China
European Union

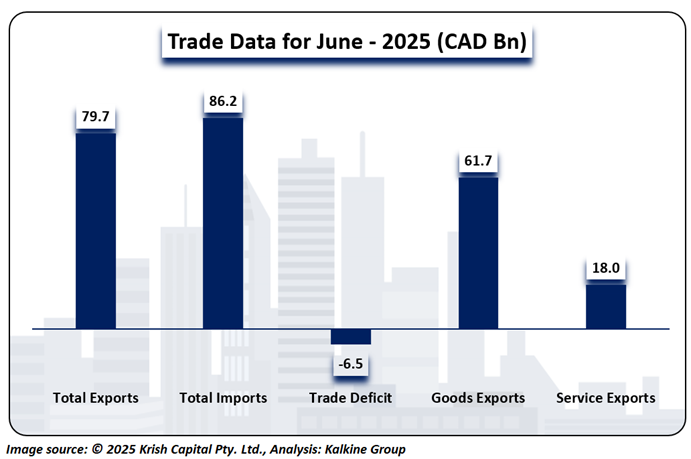
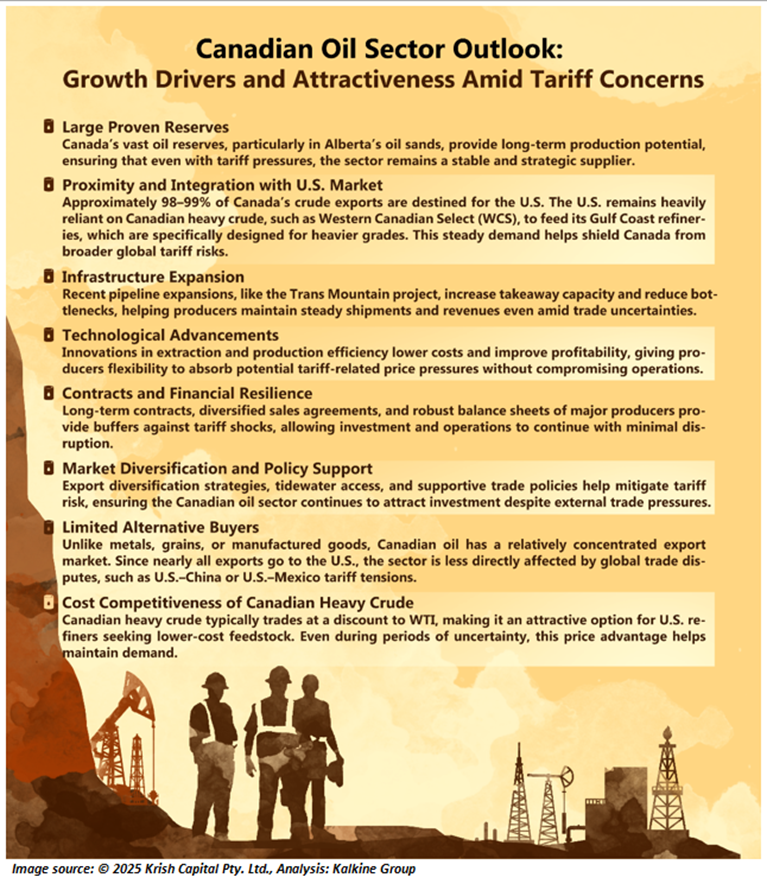
In June 2025, Canada’s total trade in goods and services reached roughly CAD ~79.7 bn in exports and CAD ~86.2 bn in imports, resulting in a combined trade deficit of CAD ~6.5 bn. This was slightly wider than May’s CAD ~6.5 bn deficit, as rising imports outpaced modest export growth.
Overall, modest gains in goods exports helped partially offset rising imports, though weak metal, auto, and service exports kept the trade recovery uneven across sectors.


Amid elevated Market Volatility and Tariff pressures, Advantage Energy Ltd. (TSX: AAV) stands out as our defensive pick within the Oil sector, supported by rigorous fundamental and technical research.
Section1: Company Overview and Fundamental Insights:

Advantage Energy Ltd (TSX: AAV) supplies clean, affordable, reliable, and sustainable Canadian energy to power the needs of Canada and the world. It is focused on the development and delineation of its Montney natural gas and liquids resource at Glacier, Wembley/Pipestone, Valhalla, and Progress, Alberta.
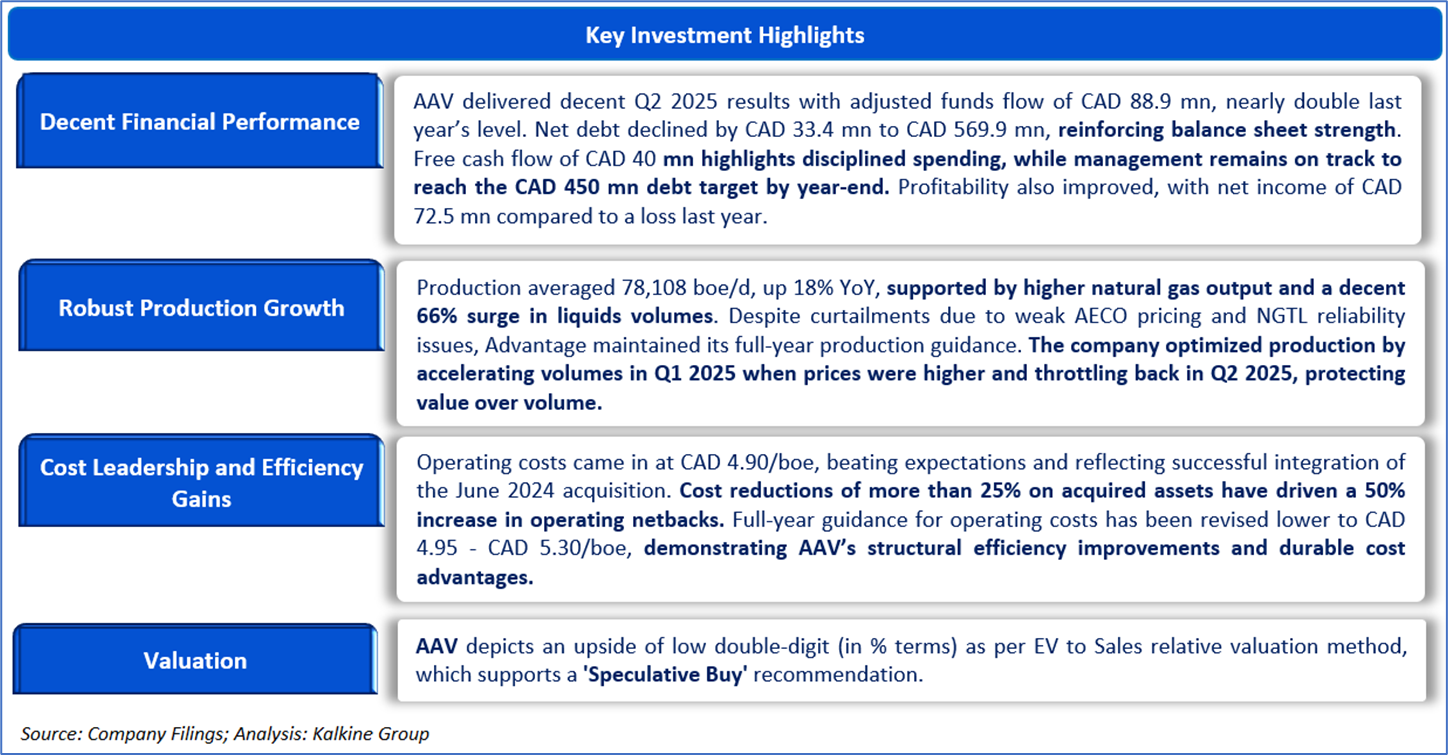
Kalkine’s Global Tariff Report covers the Investment Highlights, Key Financial Metrics, Risks, Technical Analysis along with the Valuation, Target Price, and Recommendation on the stock.
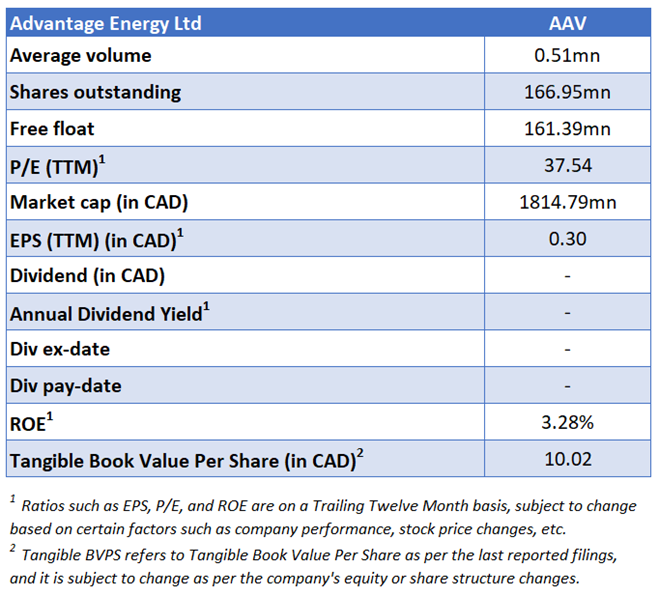


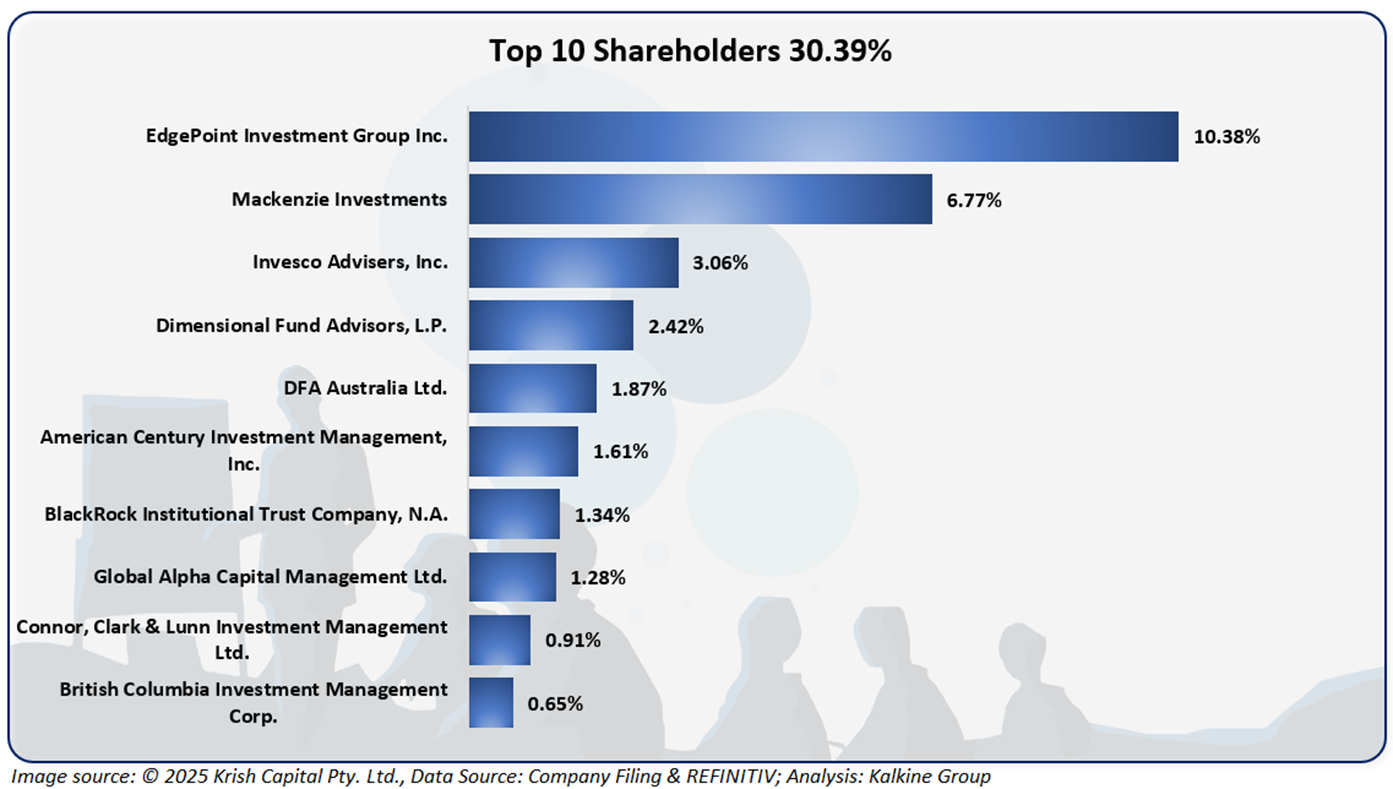
The top 10 shareholders together form ~30.39% of the total shareholding. EdgePoint Investment Group Inc. and Mackenzie Investments hold a maximum stake in the company at ~10.38% and ~6.77%, respectively.

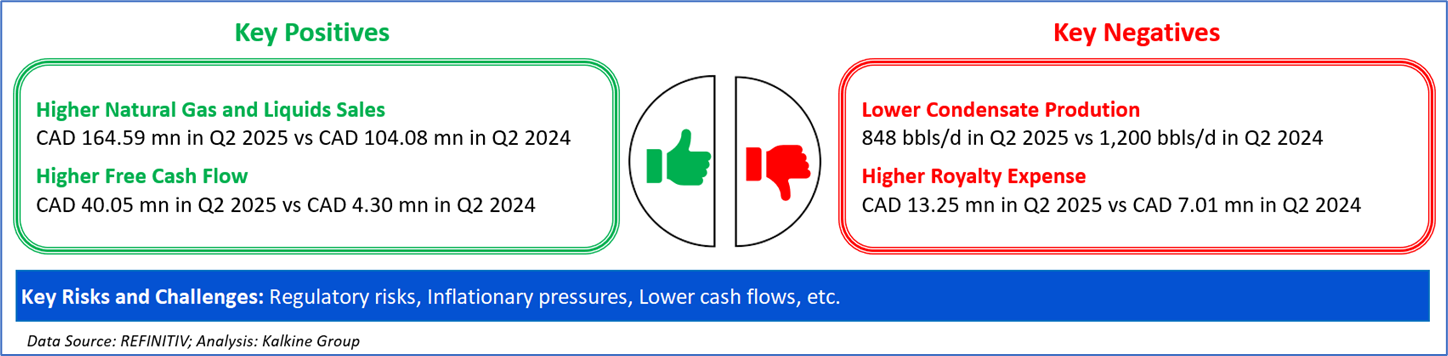
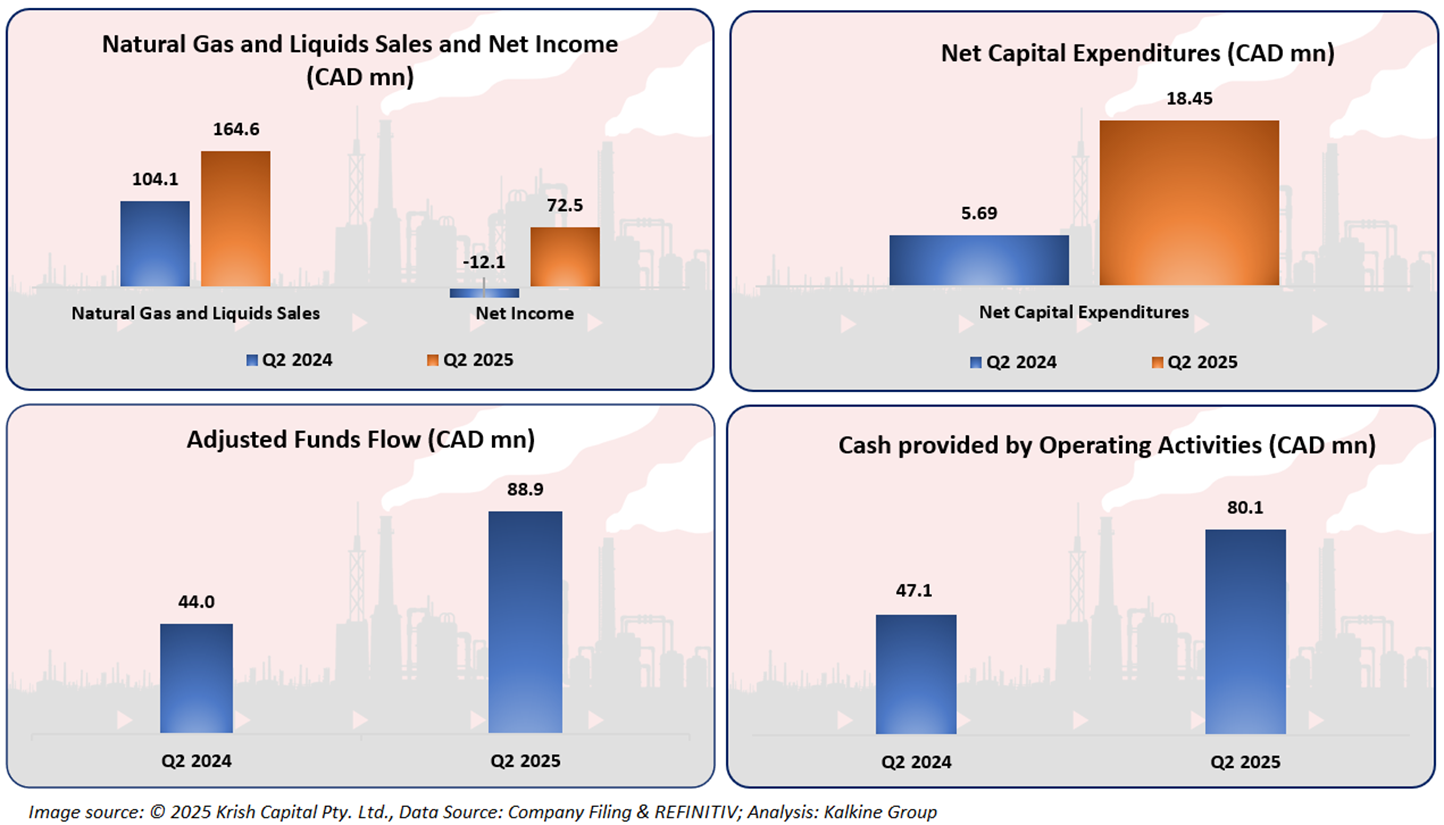
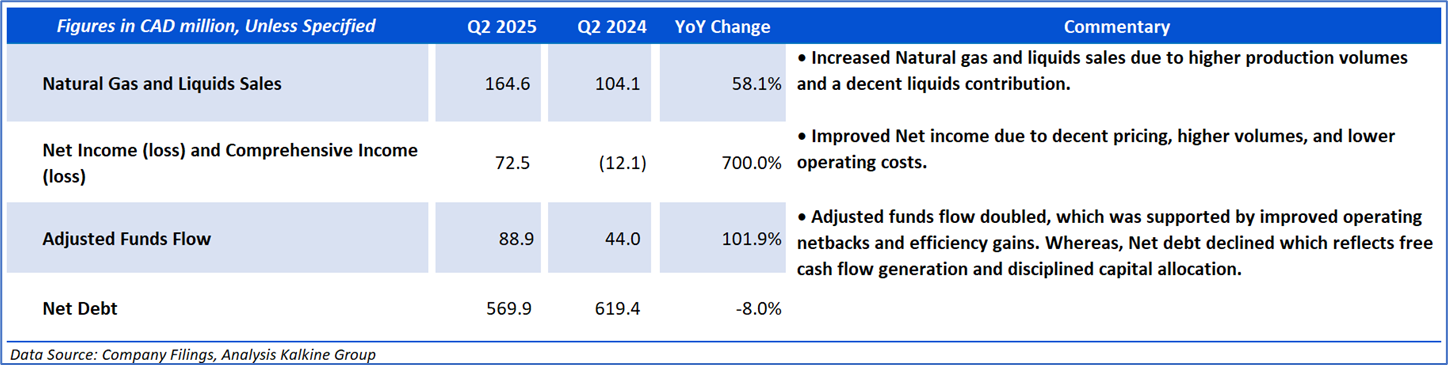
The company reported rising financials in Q2 2025, where it clocked healthy growth under its Natural Gas and Liquids Sales and Net Income, which is a key positive. Furthermore, it witnessed elevated Adjusted Funds Flow and Cash provided by Operating Activities, displaying its decent cash generation ability.
Section 2: Business Updates and Financial Highlights

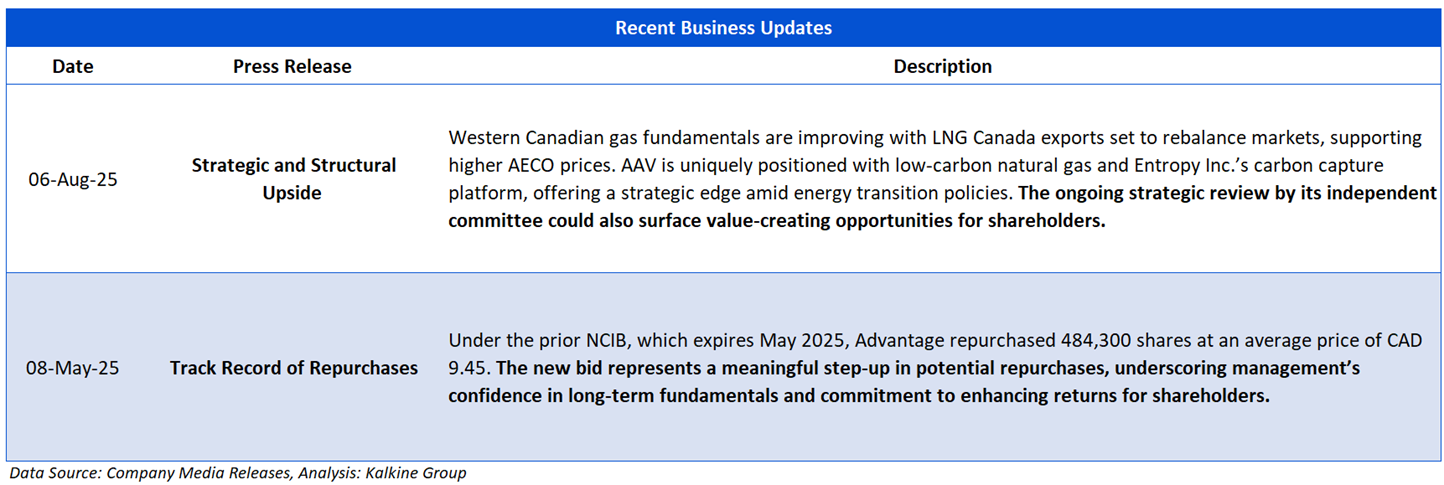
The picture below gives an overview of the company’s recent activities, such as an announcement regarding Strategic and Structural Upside and Track Record of Repurchases.

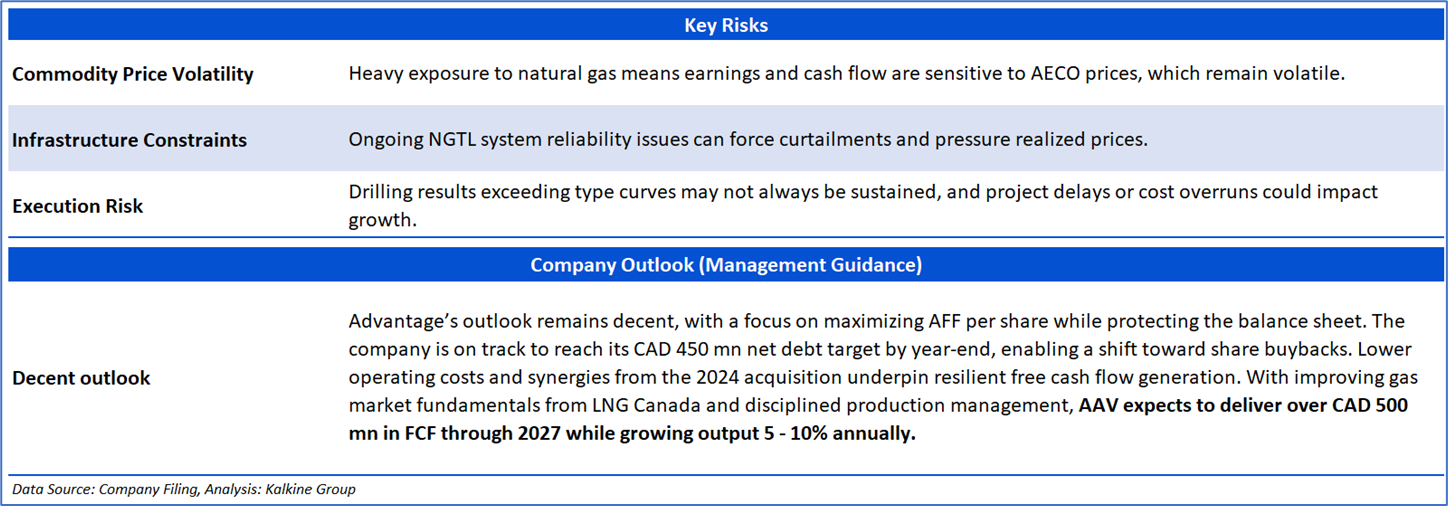
Section 3: Key Risks and Company Outlook
Section 4: Stock Recommendation Summary


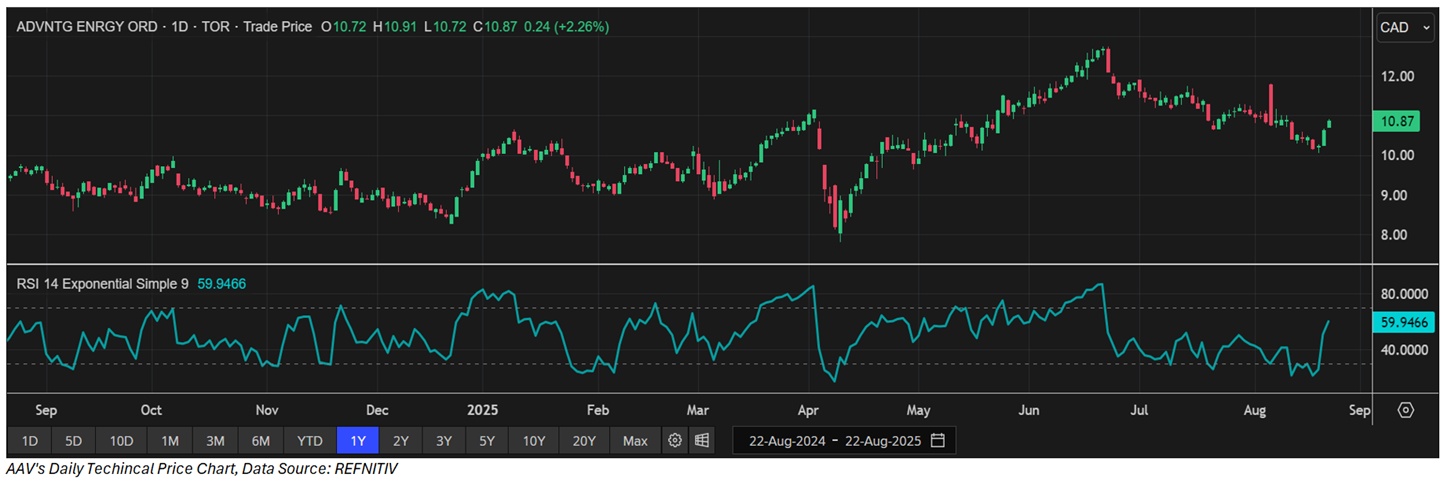
The stock has witnessed an upside of ~3.91% and a downside of ~5.47% over the last 1 week and 3 months respectively. Moreover, it is trading above the average 52-week high price of CAD 12.75 and 52-week low price of CAD 7.81, providing an opportunity to ride the trend.

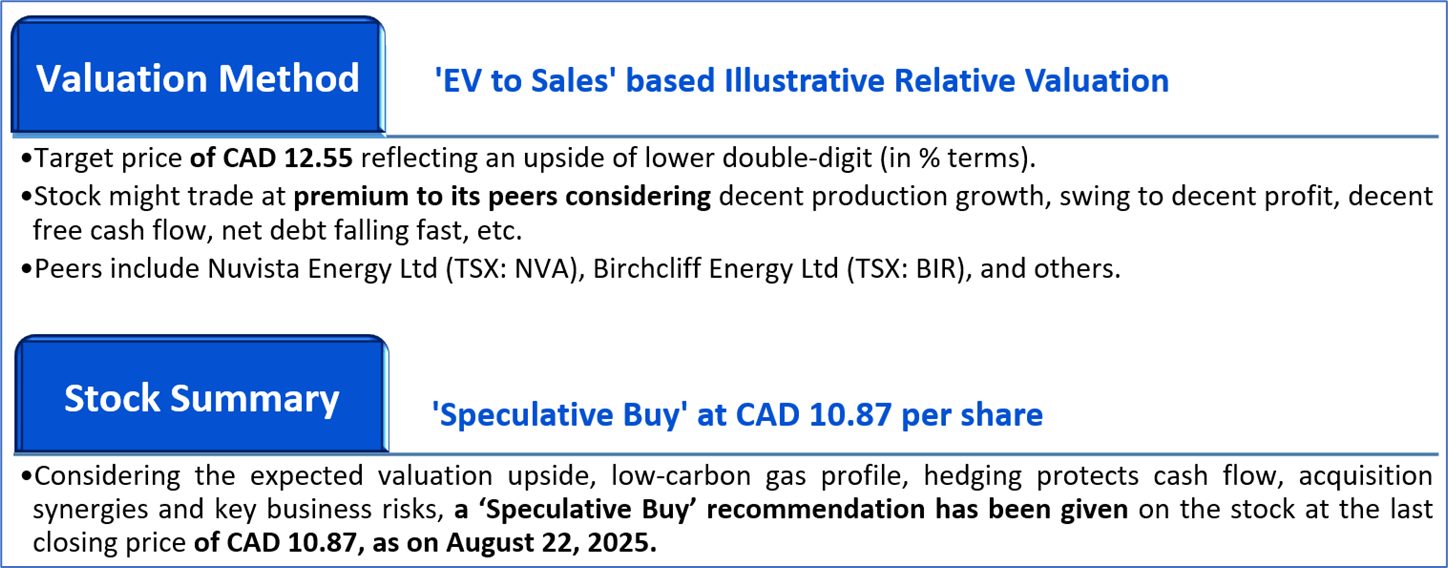
Valuation Methodology: EV to Sales Based Relative Valuation (Illustrative):

Markets are trading in a highly volatile zone currently due to certain macroeconomic issues and geopolitical tensions prevailing. Therefore, it is prudent to follow a cautious approach while investing.
Note 1: Past performance is not a reliable indicator of future performance.
Note 2: The reference date for all price data, currency, technical indicators, support, and resistance levels is August 22, 2025. The reference data in this report has been partly sourced from REFINITIV.
Note 3: Investment decisions should be made depending on an individual's appetite for upside potential, risks, holding duration, and any previous holdings. An 'Exit' from the stock can be considered if the Target Price mentioned as per the Valuation and or the technical levels provided has been achieved and is subject to the factors discussed above.
Note 4: Dividend Yield may vary as per the stock price movement.
Note 5: Kalkine reports are prepared based on the stock prices captured either from REFINITIV or Trading View. Typically, REFINITIV or Trading View may reflect stock prices with a delay which could be a lag of 25-30 minutes. There can be no assurance that future results or events will be consistent with the information provided in the report. The information is subject to change without any prior notice.
Technical Indicators Defined: -
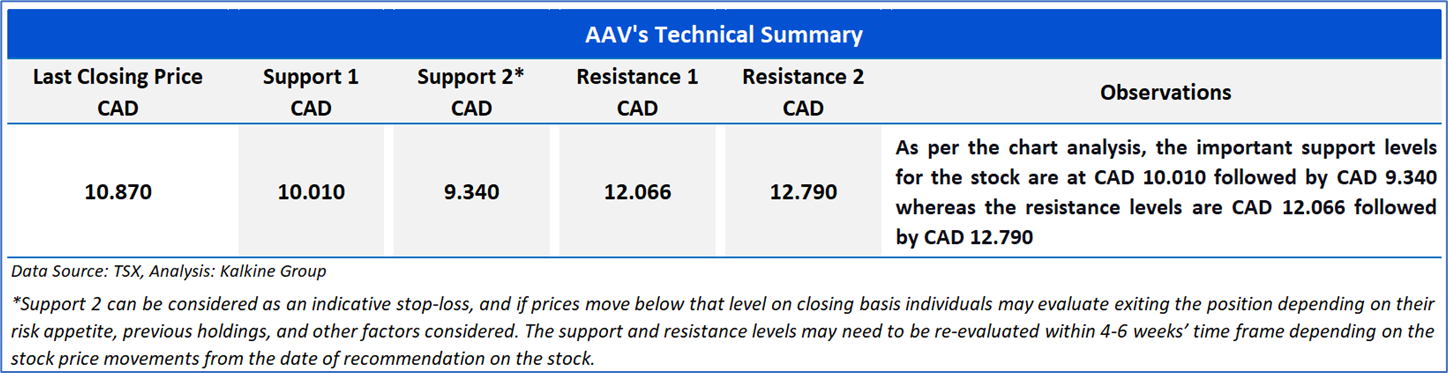
Support: A level at which the stock prices tend to find support if they are falling, and a downtrend may take a pause backed by demand or buying interest. Support 1 refers to the nearby support level for the stock and if the price breaches the level, then Support 2 may act as the crucial support level for the stock.
Resistance: A level at which the stock prices tend to find resistance when they are rising, and an uptrend may take a pause due to profit booking or selling interest. Resistance 1 refers to the nearby resistance level for the stock and if the price surpasses the level, then Resistance 2 may act as the crucial resistance level for the stock.
Stop-loss: It is a level to protect further losses in case of unfavourable movement in the stock prices.
This report (“Report”) has been issued by Kalkine Pty Limited (ABN 34 154 808 312) (Australian financial services licence number 425376) (“Kalkine”) and prepared by Kalkine and its related bodies corporate who are authorised to provide general financial product advice. Kalkine.com.au and its associated pages are published by Kalkine.
Any advice provided in this Report is general advice only and does not take into account your objectives, financial situation or needs. You should therefore consider whether the advice is appropriate for your objectives, financial situation and needs before acting upon it.
There may be a Product Disclosure Statement, Information Memorandum or other offer document (“Offer Document”) for the securities or other financial products referred in this Report. You should obtain a copy of the relevant Offer Document and consider it before making any decision about whether to acquire the security or financial product.
Kalkine strongly recommends that you seek advice from a financial adviser, stockbroker or other professional (including taxation and legal advice) before acting on any of the general advice in this Report or on the Kalkine website. Not all investments are appropriate for all people.
The information in this Report and on the Kalkine website has been prepared from a wide variety of sources, which Kalkine, to the best of its knowledge and belief, considers accurate. Kalkine has made every effort to ensure the reliability of the information contained in its reports (including this Report), newsletters and websites. All information represents our views at the date of publication and may change without notice.
The information in this Report does not constitute an offer to sell securities or other financial products or a solicitation of an offer to buy securities or other financial products. Our reports contain general recommendations to invest in securities and other financial products. Kalkine is not responsible for, and does not guarantee, the performance of, or returns on, any investments mentioned in this Report.
Kalkine does not issue, sell or deal in any financial products.
This Report may contain information on past performance of particular investments. Past performance is not a reliable indicator of future performance. Returns stated do not take into account transaction costs and taxes. To the extent permitted by law, and excluding any dishonesty or gross negligence by Kalkine, Kalkine disclaims and excludes all liability for any direct, indirect, implied, punitive, special, incidental or other consequential loss or damage arising from the use of or reliance on this Report, the Kalkine website and any information published on the Kalkine website without any warranties or representations by Kalkine to you. To the extent the law prohibits or limits this exclusion, Kalkine limits its liability to the resupply of services.
Please also read our Terms & Conditions and Financial Services Guide for further information. Employees and/or associates of Kalkine and its related entities may hold interests in the securities or other financial products covered in this Report or on the Kalkine website. Any such employees and associates are required to comply with certain, procedures and disclosures as required by law.
Kalkine Media Pty Ltd, an affiliate of Kalkine Pty Ltd, may have received, or be entitled to receive, financial consideration in connection with providing information about certain entity(s) covered on its website including entities covered in this Report.
Copyright 2025 Krish Capital Pty. Ltd. (ABN 61629651510). All Rights Reserved. No part of this report, or its content, may be reproduced in any form without our prior consent.
Past performance is not a reliable indicator of future performance.
 Please wait processing your request...