Kalkine has a fully transformed New Avatar.

Section 1: Company Overview and Fundamentals
1.1 Company Overview:
ACM Research, Inc. (NASDAQ: ACMR) develops, manufactures and sells semiconductor process equipment for single-wafer or batch wet cleaning, electroplating, polishing and thermal processes that are critical to advanced semiconductor device manufacturing, as well as wafer-level packaging. The Company offers two principal models of wet wafer cleaning equipment based on its Space Alternated Phase Shift (SAPS) technology, Ultra C SAPS II and Ultra C SAPS V.
Kalkine’s Diversified Opportunities Report covers the Company Overview, Key positives & negatives, Investment summary, Key investment metrics, Top 10 shareholding, Business updates and insights into company recent financial results, Key Risks & Outlook, Price performance and technical summary, Target Price, and Recommendation on the stock.
Stock Performance:
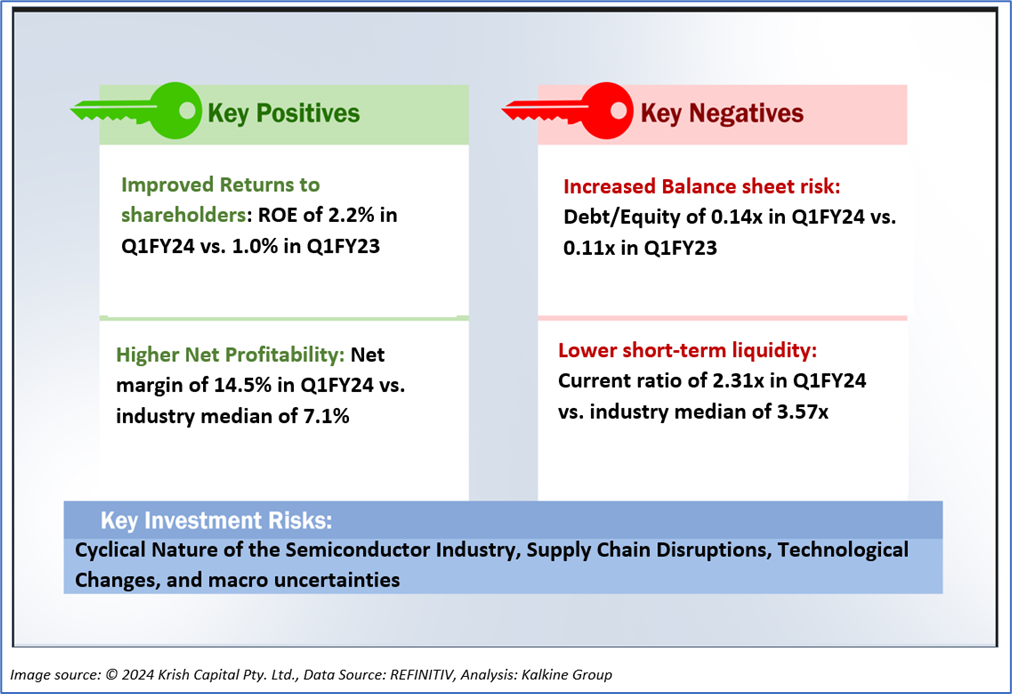
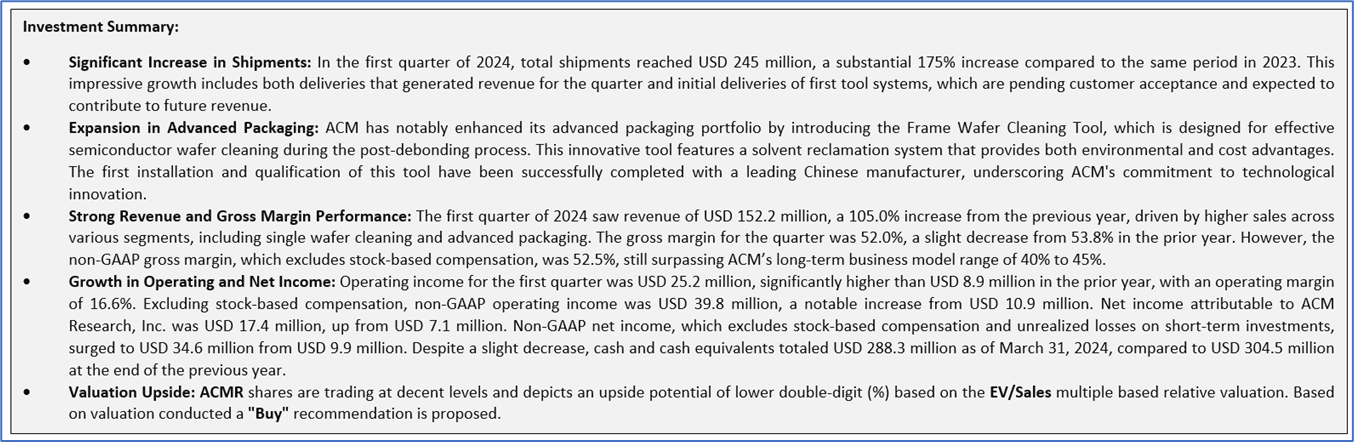
1.2 The Key Positives, Negatives, and Investment summary
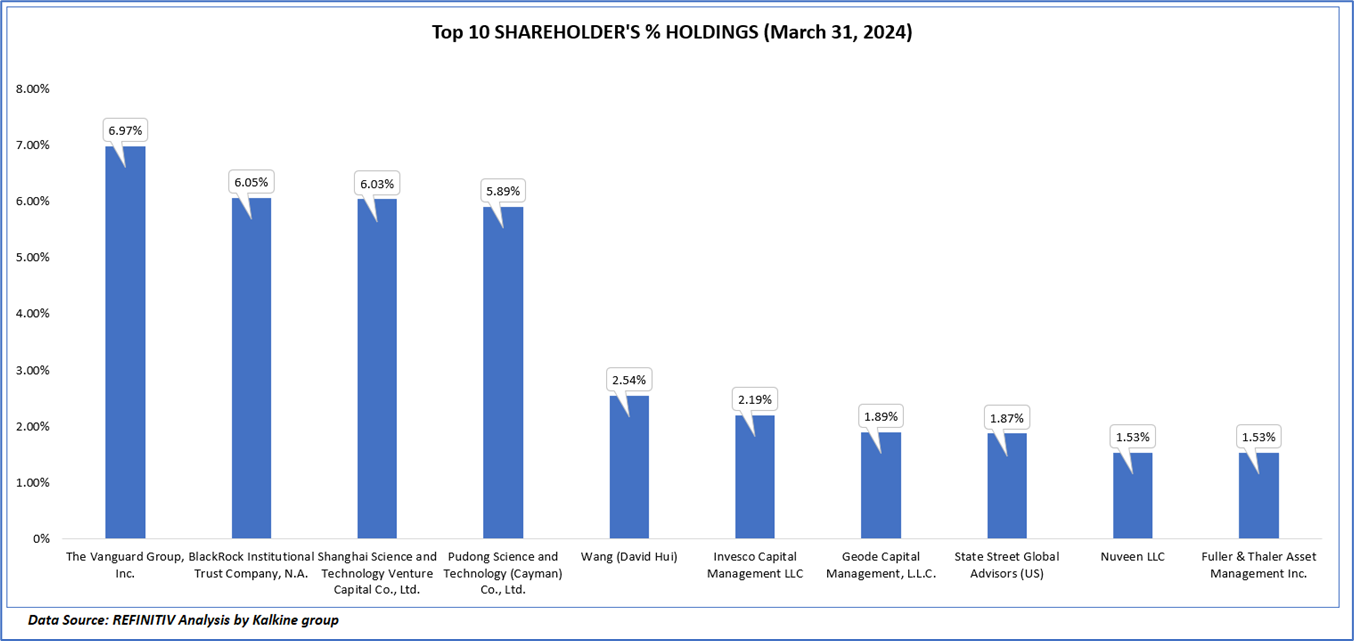
1.3 Top 10 shareholders:
The top 10 shareholders together form ~36.51% of the total shareholding, signifying diverse shareholding. The Vanguard Group, Inc., and BlackRock Institutional Trust Company, N.A. are the biggest shareholders, holding the maximum stake in the company at ~6.97% and ~6.05%, respectively.
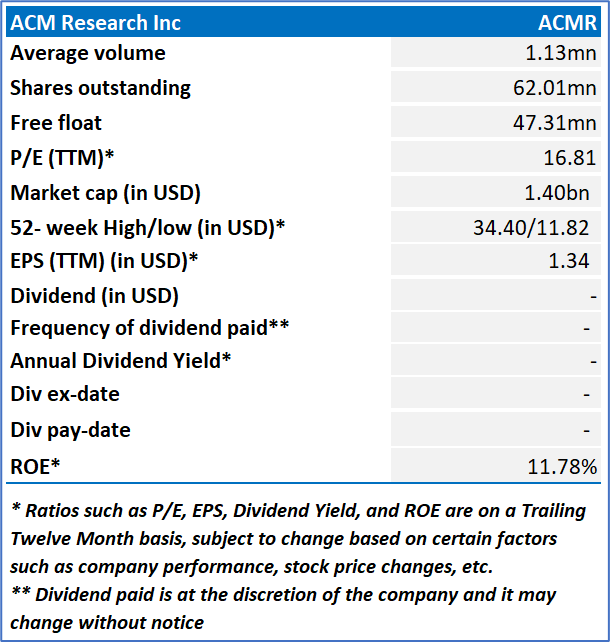
1.4 Key Metrics
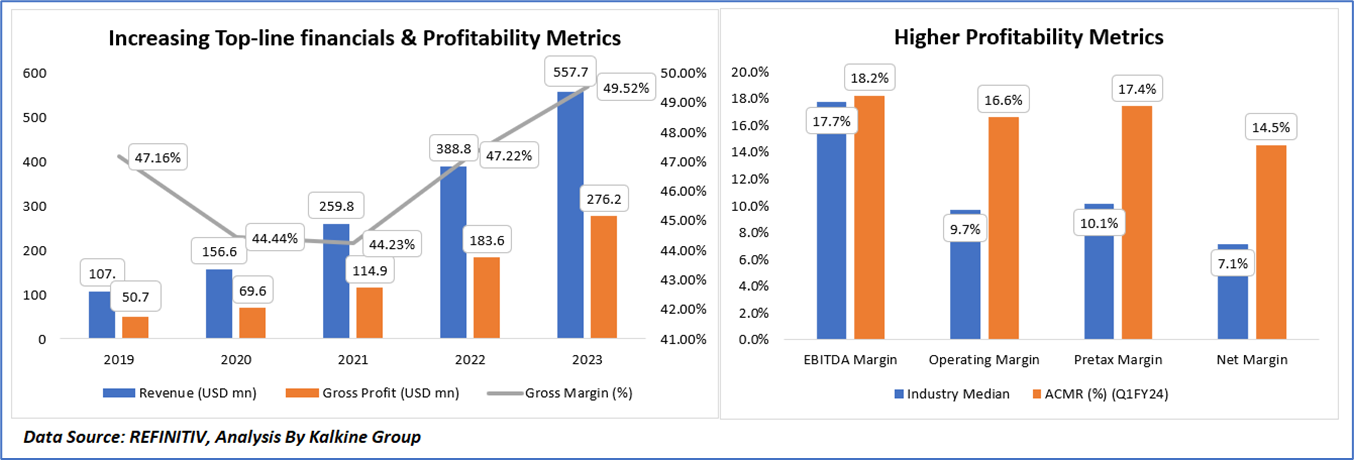
From 2019 to 2023, ACM Research, Inc. experienced notable revenue growth, increasing from USD 107.5 million in 2019 to USD 557.7 million in 2023. During the same period, gross profit also rose significantly from USD 50.7 million to USD 276.2 million, reflecting the company's enhanced operational efficiency and effective cost management. The gross margin showed an overall improvement, starting at 47.16% in 2019 and reaching 49.52% in 2023, despite slight fluctuations. This upward trend in gross margin indicates ACM Research's ability to improve profitability through efficient operations and strategic pricing. Furthermore, an analysis of the company's financial performance in Q1FY24 reveals that its EBITDA margin was 18.2%, operating margin was 16.6%, pretax margin was 17.4%, and net margin was 14.5%, all of which were significantly higher than the respective industry medians of 17.7%, 9.7%, 10.1%, and 7.1%. This strong performance across key financial metrics underscores ACM Research's robust competitive position and its capability to sustain growth and maintain financial health.
Section 2: Business Updates and Corporate Business Highlights
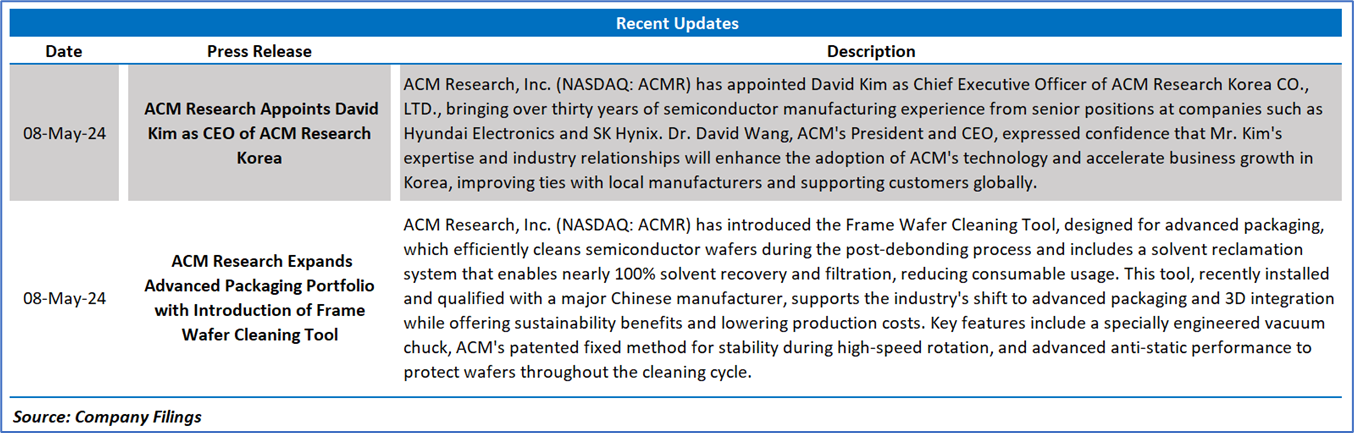
2.1 Recent Updates:
The below picture gives an overview of the recent updates:
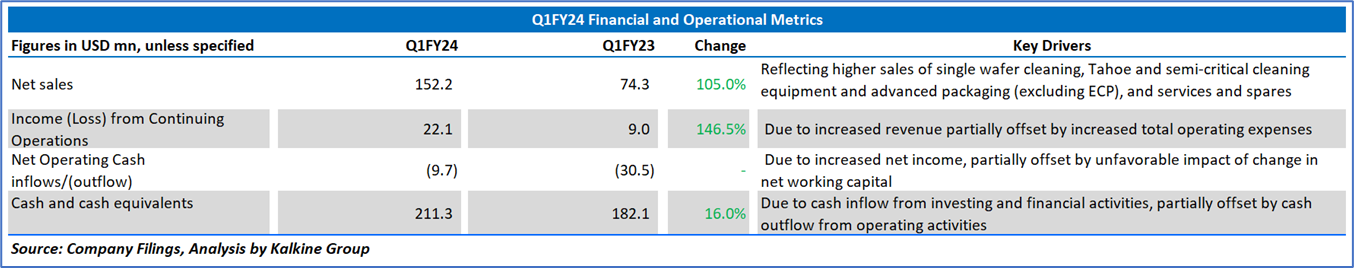
2.2 Insights of Q1FY24:
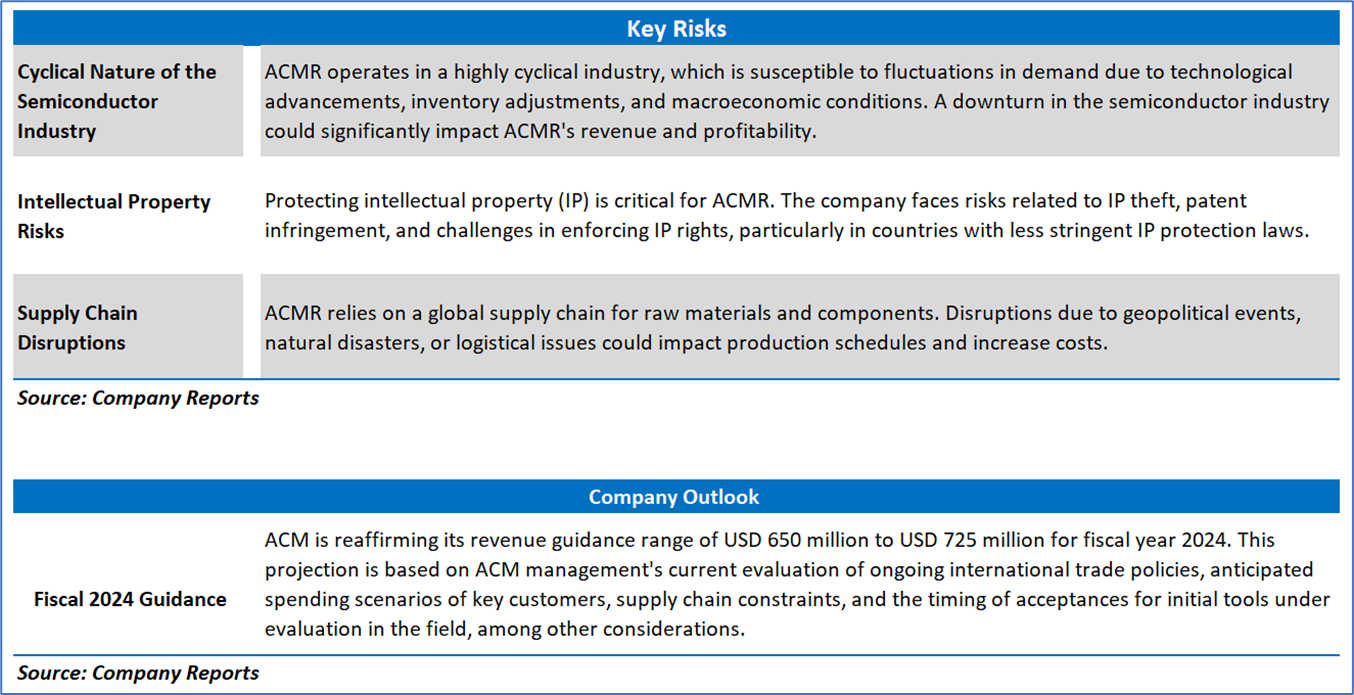
Section 3: Key Risks & Outlook
Section 4: Stock Recommendation Summary:
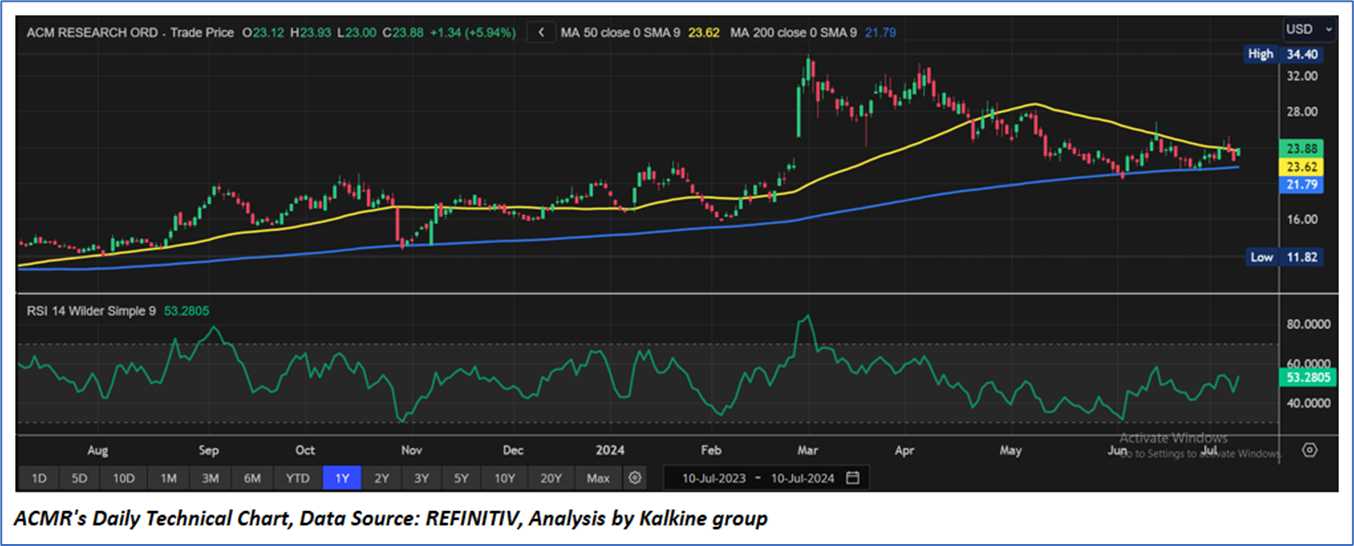
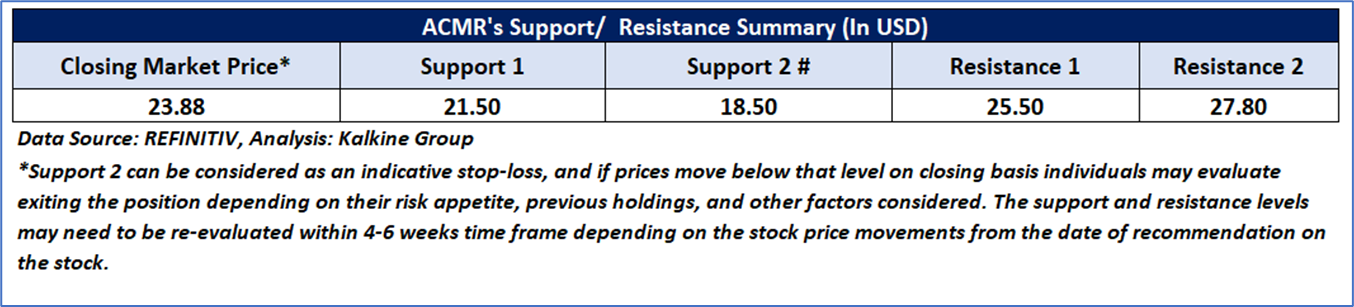
4.1 Price Performance and Technical Summary:
Stock Performance:
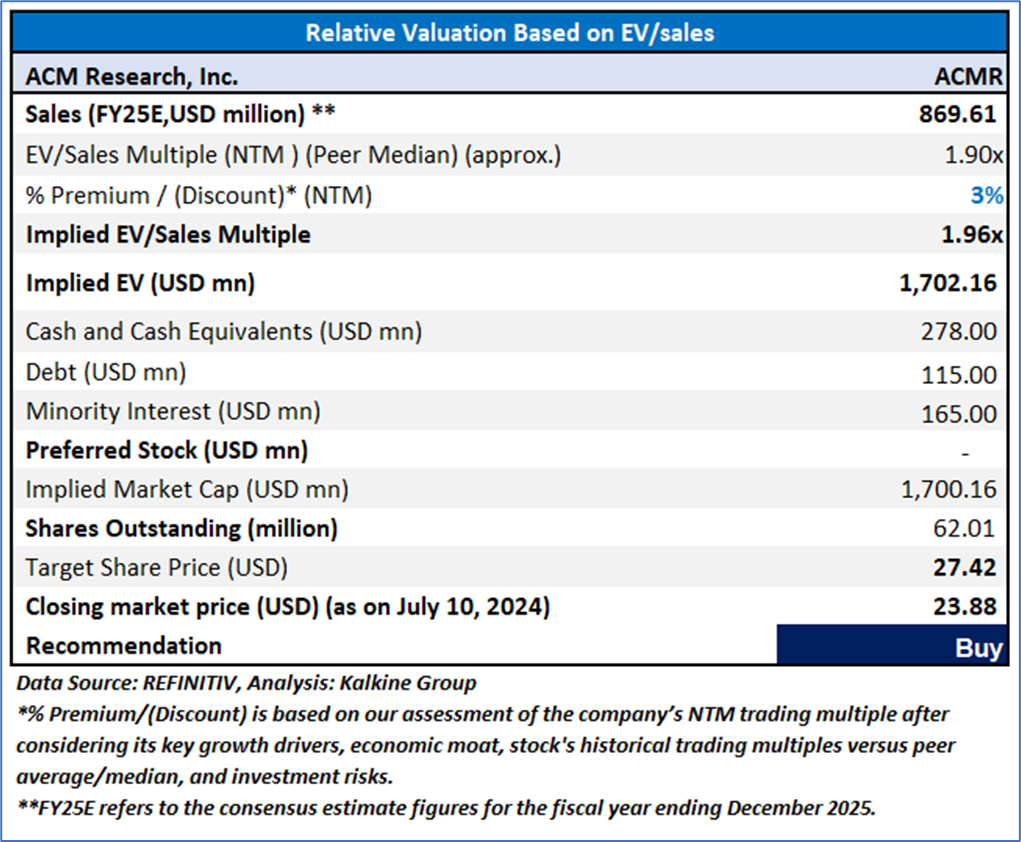
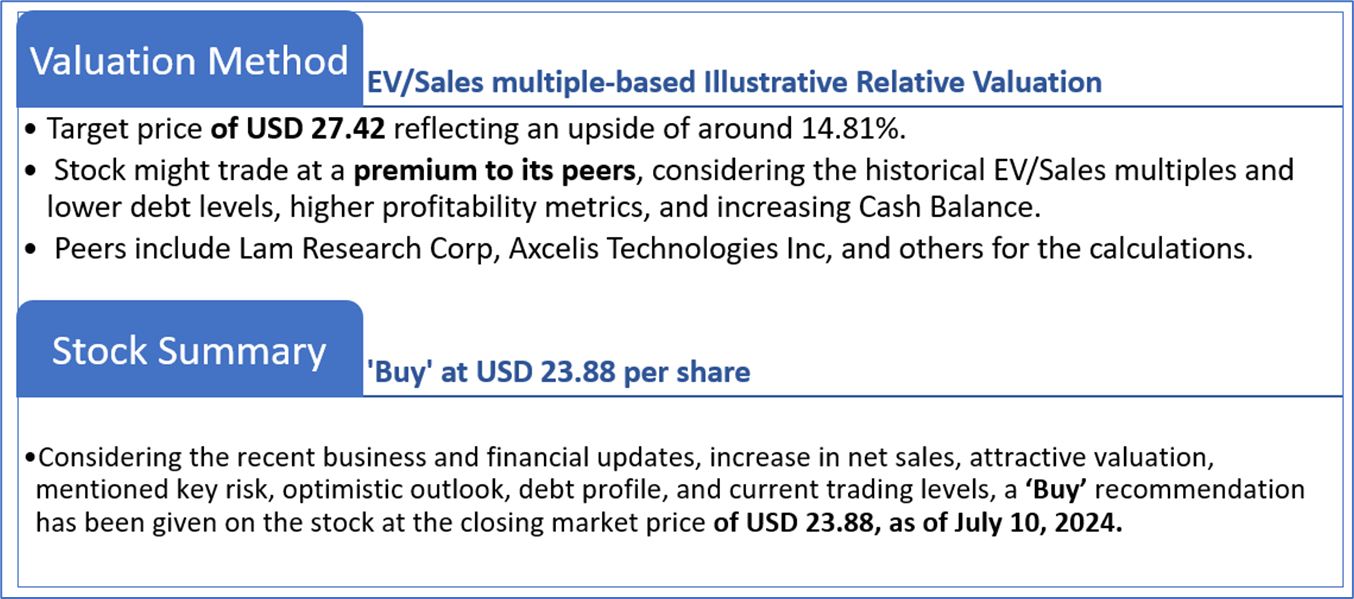
4.2 Fundamental Valuation
Valuation Methodology: EV/Sales Multiple Based Relative Valuation
Markets are trading in a highly volatile zone currently due to certain macroeconomic issues and geopolitical tensions prevailing. Therefore, it is prudent to follow a cautious approach while investing.
Note 1: Past performance is not a reliable indicator of future performance.
Note 2: The reference date for all price data, currency, technical indicators, support, and resistance levels is June 05, 2024. The reference data in this report has been partly sourced from REFINITIV.
Note 3: Investment decisions should be made depending on an individual's appetite for upside potential, risks, holding duration, and any previous holdings. An 'Exit' from the stock can be considered if the Target Price mentioned as per the Valuation and or the technical levels provided has been achieved and is subject to the factors discussed above.
Note 4: The report publishing date is as per the Pacific Time Zone.
Technical Indicators Defined: -
Support: A level at which the stock prices tend to find support if they are falling, and a downtrend may take a pause backed by demand or buying interest. Support 1 refers to the nearby support level for the stock and if the price breaches the level, then Support 2 may act as the crucial support level for the stock.
Resistance: A level at which the stock prices tend to find resistance when they are rising, and an uptrend may take a pause due to profit booking or selling interest. Resistance 1 refers to the nearby resistance level for the stock and if the price surpasses the level, then Resistance 2 may act as the crucial resistance level for the stock.
Stop-loss: It is a level to protect against further losses in case of unfavorable movement in the stock prices.
This report has been issued by Kalkine Pty Limited (ABN 34 154 808 312) (Australian financial services licence number 425376) (“Kalkine”) and prepared by Kalkine and its related bodies corporate authorised to provide general financial product advice. Kalkine.com.au and associated pages are published by Kalkine.
Any advice provided in this report is general advice only and does not take into account your objectives, financial situation or needs. You should therefore consider whether the advice is appropriate to your objectives, financial situation and needs before acting upon it.
There may be a Product Disclosure Statement, Information Statement or other offer document for the securities or other financial products referred to in Kalkine reports. You should obtain a copy of the relevant Product Disclosure Statement, Information Statement or offer document and consider the statement or document before making any decision about whether to acquire the security or product.
Choosing an investment is an important decision. If you do not feel confident making a decision based on the recommendations Kalkine has made in our reports, you should consider seeking advice from a financial adviser, stockbroker or other professional (including taxation and legal advice) before acting on any advice in this report or on the Kalkine website. Not all investments are appropriate for all people.
The information in this report and on the Kalkine website has been prepared from a wide variety of sources, which Kalkine, to the best of its knowledge and belief, considers accurate. Kalkine has made every effort to ensure the reliability of information contained in its reports, newsletters and websites. All information represents our views at the date of publication and may change without notice. The information in this report does not constitute an offer to sell securities or other financial products or a solicitation of an offer to buy securities or other financial products. Our reports contain general recommendations to invest in securities and other financial products.
Kalkine is not responsible for, and does not guarantee, the performance of the investments mentioned in this report This report may contain information on past performance of particular investments. Past performance is not an indicator of future performance. Hypothetical returns may not reflect actual performance. Any displays of potential investment opportunities are for sample purposes only and may not actually be available to investors. To the extent permitted by law, Kalkine excludes all liability for any loss or damage arising from the use of this report, the Kalkine website and any information published on the Kalkine website (including any indirect or consequential loss, any data loss or data corruption). If the law prohibits this exclusion, Kalkine hereby limits its liability, to the extent permitted by law, to the resupply of services..
Please also read our Terms & Conditions and Financial Services Guide for further information. Employees and/or associates of Kalkine and its related entities may hold interests in the securities or other financial products covered in this report or on the Kalkine website. Any such employees and associates are required to comply with certain safeguards, procedures and disclosures as required by law.
Kalkine Media Pty Ltd, an affiliate of Kalkine Pty Ltd, may have received, or be entitled to receive, financial consideration in connection with providing information about certain entity(s) covered on its website including entities covered in this Report.
 Please wait processing your request...