
 CA
 NZ
 UK
 US
 IND

 AU

 Share
 X (Formerly Twitter)
 Whatsapp
 Facebook
 LinkedIn
 Telegram
 Email This Article
 Copy Link
 Summarize with AI
 Chat GPT
 Perplexity
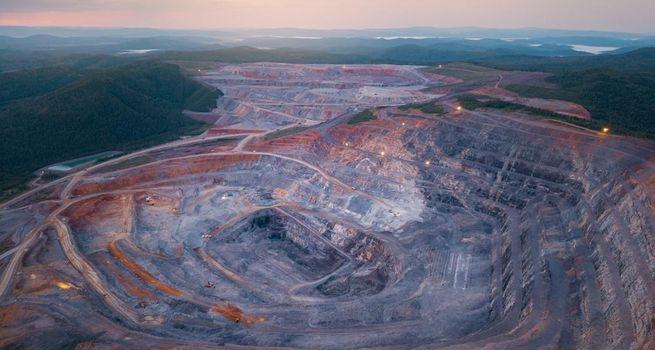
The global tin industry is one of the smallest major metal markets by volume, but its strategic importance is disproportionately large. Annual global tin production is approximately 300,000 to 320,000 tonnes, compared to over 2 billion tonnes for iron ore or 25 million tonnes for copper. This relatively small market size means that even modest changes in supply or demand can have outsized effects on prices.
Market Size and Value
The global tin market was valued at approximately US$12 to 15 billion annually in recent years, based on production volumes multiplied by average prices. With tin prices surging in 2025 and 2026, the market value has expanded significantly. At US$44,000 per tonne and annual production of approximately 310,000 tonnes, the global tin market is worth roughly US$13.6 billion at the mine level.
Supply Geography
Tin production is heavily concentrated in a small number of countries, which creates significant supply chain risk. China is the world’s largest tin producer, accounting for approximately 45 percent of global refined tin output. China produced approximately 194,000 tonnes of refined tin in 2024. Indonesia is the second-largest producer, with annual output fluctuating between 70,000 and 84,000 tonnes depending on regulatory conditions and enforcement of environmental standards. Myanmar is the third-largest producer, though output has been severely disrupted since the Wa State mining ban in August 2023.
Other significant producing countries include Peru, Bolivia, the Democratic Republic of Congo (DRC), Brazil, and Australia. Australia’s contribution to global tin supply is modest in volume terms — Renison Bell’s annual output represents roughly 3 percent of global production — but Australia is one of the few Western, democratic, rule-of-law jurisdictions with active tin mining, giving it strategic significance.
Demand Geography
China is also the world’s largest tin consumer, driven by its dominant position in global electronics manufacturing. Japan, South Korea, Taiwan, and Southeast Asian nations are also major consumers due to their semiconductor and electronics assembly industries. The United States and European Union are significant consumers, though their share of global tin consumption has declined as manufacturing has shifted to Asia.
Pricing Mechanism
Tin is priced primarily on the London Metal Exchange (LME), where three-month tin futures contracts set the benchmark for global transactions. The LME tin contract is quoted in US dollars per tonne. Other pricing venues include the Kuala Lumpur Tin Market (KLTM) and the Indonesia Tin Exchange (INATIN), though the LME remains the dominant reference price.
The tin price is influenced by the physical balance between supply and demand, LME warehouse inventory levels, speculative positioning by financial traders, macroeconomic conditions (particularly the strength of the US dollar and global manufacturing activity), and geopolitical events affecting major producing countries.
Recent Price History
Tin prices have been on a volatile but generally upward trajectory since 2020. During the COVID-19 pandemic, tin fell below US$15,000 per tonne before staging a dramatic recovery that took prices above US$50,000 per tonne in early 2022. Prices then corrected sharply during the global interest rate hiking cycle of 2022-2023 before resuming their upward trend in 2024.
As of March 2026, the LME tin price is approximately US$44,818 per tonne, reflecting a one-year return of 27.79 percent. The price has been supported by persistent supply constraints in Myanmar, regulatory uncertainty in Indonesia, conflict-related disruptions in the DRC, and accelerating demand from the semiconductor and clean energy sectors.
Understanding Tin Geology and Exploration
For investors evaluating ASX tin companies, a basic understanding of tin geology and exploration methods provides important context for interpreting company announcements, drill results, and resource estimates.
How Tin Deposits Form
Tin deposits are formed through geological processes involving the concentration of tin from the Earth’s crust into economically mineable accumulations. The primary source of tin in most hard-rock deposits is the mineral cassiterite (SnO2), which contains approximately 78.8 percent tin by weight. Cassiterite is a dense, hard mineral that resists weathering, which is why it accumulates in alluvial (river) deposits as well as in its primary hard-rock settings.
Most of the world’s significant tin deposits are associated with granitic intrusions. When molten granite (magma) cools and crystallises deep within the Earth’s crust, tin and other metals become concentrated in the residual fluids expelled by the crystallising magma. These hot, metal-bearing fluids (known as hydrothermal fluids) migrate through fractures and faults in the surrounding rock, depositing tin and other minerals in veins, replacement bodies, and disseminated zones.
Tin deposits can be classified into several geological types. Vein deposits consist of cassiterite-bearing veins in fracture systems, often with associated quartz, tourmaline, and sulphide minerals. These tend to be high-grade but narrow, requiring selective underground mining. Replacement deposits form when tin-bearing fluids replace existing carbonate or other reactive rocks with cassiterite and associated minerals. The Renison Bell deposit is a classic example of a carbonate replacement tin deposit, where hydrothermal fluids replaced dolomite (a carbonate rock) with cassiterite, pyrrhotite, and other minerals. Greisen deposits form in the altered margins of granitic intrusions, where the granite itself has been chemically altered by its own fluids. Alluvial deposits are accumulations of cassiterite grains in river gravels and floodplains, derived from the weathering and erosion of primary tin deposits upstream.
Exploration Methods
Tin exploration on the ASX involves a progression of techniques designed to identify and delineate tin mineralisation with increasing precision and confidence.
Geological mapping is the foundation of all mineral exploration. Geologists walk the ground, examining rock outcrops, recording structural features, and identifying alteration patterns that may indicate the presence of tin mineralisation. In historical tin districts like Tasmania’s west coast and Queensland’s Herberton Tin Field, extensive historical mining records and geological surveys provide a head start.
Geochemical sampling involves collecting soil, stream sediment, and rock chip samples and analysing them for tin and associated pathfinder elements (tungsten, arsenic, boron, fluorine, copper). Elevated concentrations of these elements can indicate the proximity of a tin deposit. Koba Resources’ recent rock chip results of up to 26.1 percent tin at Stannary Hills are an example of geochemical sampling identifying high-grade surface mineralisation.
Geophysical surveys use instruments to measure variations in the Earth’s magnetic, gravitational, electrical, and electromagnetic fields. Tin deposits often produce subtle geophysical signatures that can guide drilling. Ground-penetrating radar, induced polarisation (IP), and electromagnetic (EM) surveys are commonly used in tin exploration.
Diamond drilling is the definitive exploration tool. A diamond-tipped drill bit extracts a continuous core of rock from the subsurface, allowing geologists to examine the geology, mineralisation, and structure in detail. Drill core is logged, photographed, split, and sent to an assay laboratory for chemical analysis. Drill results are reported as intervals of mineralisation expressed as metres of intersection at a percentage grade of tin (e.g., “10 metres at 1.5% Sn from 120 metres downhole”).
Interpreting Exploration Results
When ASX tin companies announce drill results, investors should consider several factors. Intersection width matters because wider intersections generally indicate larger deposits with more mining flexibility. True width (the actual thickness of the mineralised zone) is more meaningful than drilled width (the length along the drill hole), which can be inflated if the hole intersects the zone at an oblique angle.
Grade is the concentration of tin in the rock, expressed as a percentage. Higher grades mean more tin per tonne of rock mined, which translates to higher revenue per tonne processed and lower unit costs. Tin deposits typically range from 0.3 percent (low grade) to 3 percent or higher (very high grade by tin standards). Renison Bell’s reserve grade is approximately 1.3 to 1.5 percent tin, which is considered moderate to good for an underground operation.
Continuity describes how consistently the mineralisation extends across the deposit. Drilling on close spacing (e.g., 25-metre centres) provides higher confidence in continuity than drilling on wide spacing (e.g., 100-metre centres). The JORC classification system reflects this: Measured resources have the highest confidence (close-spaced drilling), Indicated resources have moderate confidence, and Inferred resources have the lowest confidence.
Metallurgy — the ability to extract tin from the ore through processing — is critical but often overlooked by retail investors. A high-grade tin deposit is worthless if the tin cannot be efficiently separated from the host rock. Metallurgical testwork examines how the ore responds to crushing, grinding, gravity separation, and flotation, and determines the expected tin recovery rate (the percentage of tin in the ore that ends up in the concentrate).
[Internal Link: How to Read Drill Results for Mining Stocks]


 Nov 13, 2026





 Please wait processing your request...