
 CA
 NZ
 UK
 US
 IND

 AU

 Share
 X (Formerly Twitter)
 Whatsapp
 Facebook
 LinkedIn
 Telegram
 Email This Article
 Copy Link
 Summarize with AI
 Chat GPT
 Perplexity

Some stories are easier to see than to read — and when you plot the indicative yields of ten high-paying ASX 200 names including Arena REIT (ASX:ARF) and BWP Group (ASX:BWP) as bars using prices at the close on 23 September 2026, a clear shape appears. Plot the indicative yields of ten high-paying ASX 200 names as bars, using prices at the close on Wednesday 23 September 2026, and a clear shape appears: one bar standing well above the rest, three bunched just below it, a crowded middle and a single bar trailing at the end. That shape says a lot about where income is concentrated after the 2026 reporting season, with property trusts filling the upper tiers. It says much less about whether those payouts will hold. This article walks through the chart tier by tier, explains what drives each bar, and sets out what any Yield chart leaves out of the picture.
|
Company |
ASX Code |
Dividend Amount |
Share Price |
Yield |
|---|---|---|---|---|
|
Arena REIT |
19.25c (FY2026) |
A$2.15 |
8.95% |
|
|
HomeCo Daily Needs REIT |
8.60c (FY2026) |
A$1.095 |
7.85% |
|
|
Waypoint REIT |
16.64c (FY2025*) |
A$2.21 |
7.53% |
|
|
Charter Hall Long WALE REIT |
25.50c (FY2026) |
A$3.39 |
7.52% |
|
|
Harvey Norman Holdings Limited |
27.50c (FY2026) |
A$4.18 |
6.58% |
|
|
Fortescue Ltd |
A$1.08 (FY2026) |
A$16.85 |
6.41% |
|
|
Metcash Limited |
18.0c (FY2026) |
A$2.84 |
6.34% |
|
|
AGL Energy Limited |
50c (FY2026) |
A$8.21 |
6.09% |
|
|
Stockland |
25.2c (FY2026) |
A$4.20 |
6.00% |
|
|
BWP Group |
19.41c (FY2026) |
A$3.59 |
5.41% |
Source note: Dividend and distribution amounts are the latest confirmed full-year payouts from official ASX company announcements. Reference prices are from an S&P/ASX 200 component snapshot after the close on 23 September 2026. Indicative yield = annual payout ÷ reference price (our calculation, not an ASX-published figure); cash yields exclude franking credits.
*Waypoint REIT reports on a calendar-year basis; FY2025 (year to 31 December 2025) is its latest completed full year.
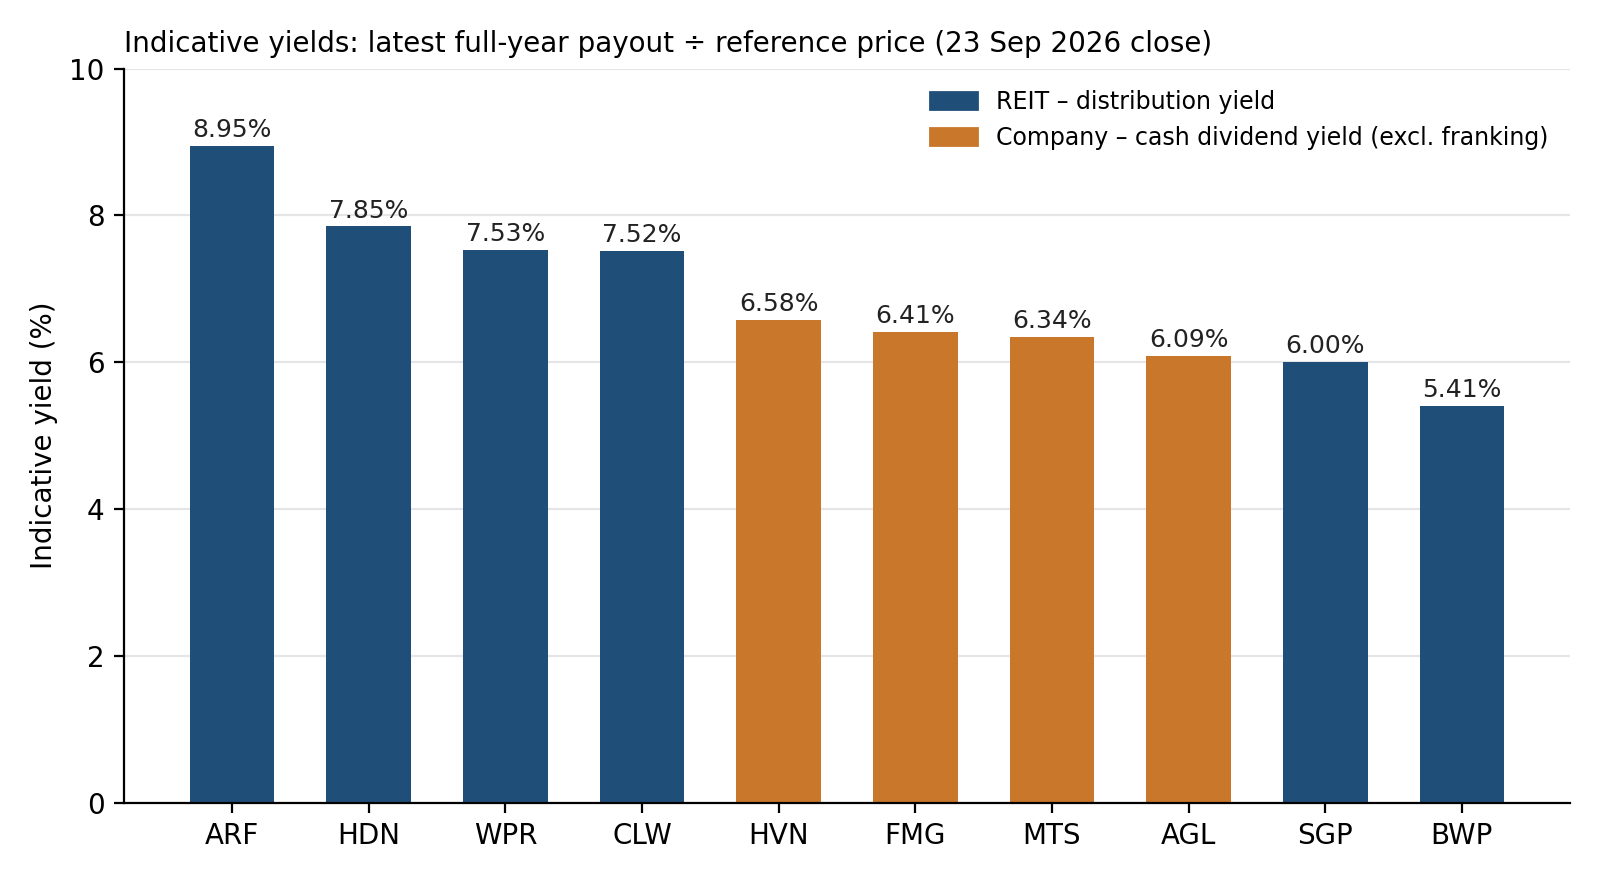
Chart: indicative yields based on latest confirmed full-year payouts and reference prices at the 23 September 2026 close. Cash yields exclude franking credits.
Why are investors charting yields in 2026?
With full-year payouts now declared, income-focused investors have fresh figures to line up side by side. A chart does that at a glance, turning dividends and distributions of very different sizes into a single comparable measure. It also exposes patterns a table can hide, such as how much of the upper half is made up of property trusts, and how few names stand apart from the pack.
How to read the chart
Each bar is our own calculation: the latest confirmed full-year payout divided by the 23 September reference price. ASX does not publish these yields. The bars are cash-only, so they exclude franking credits on the four company dividends. Because price sits in the denominator, each bar would shorten if that share price rose and lengthen if it fell, even with no change in the payout. The chart is a snapshot of one trading day, not a forecast.
The outlier near 9%
Arena REIT (ASX:ARF)
The tallest bar belongs to Arena, at 8.95%, from an FY2026 distribution of 19.25c per security against a A$2.15 price. That payout was up 5.5% and paid quarterly at 4.8125c. Arena owns 274 early learning centres and 10 healthcare properties, with a weighted average Lease expiry (WALE) of about 17.5 years.
What the bar cannot show is the August 2026 event behind it. Tenant Edge Early Learning, about 14% of income across 31 leases, failed to pay rent and entered voluntary administration. For FY2027, Arena expects to pay at least 18.0c, a step down that assumes no rent from Edge after 1 August 2026. The tallest bar is built on a payout the trust does not currently expect to repeat.
The tight cluster between 7.5% and 7.9%
Three trusts with quite different tenant bases land within a whisker of one another.
HomeCo Daily Needs REIT (ASX:HDN)
HDN's 7.85% comes from an 8.60c distribution on a A$1.095 price. Its supermarket-anchored centres generated Funds From Operations (FFO) of 9.0c, and FY2027 guidance holds the distribution at 8.6c despite higher finance costs.
Waypoint REIT (ASX:WPR)
Waypoint's bar, 7.53%, uses its FY2025 distribution of 16.64c, paid in four quarterly instalments, because its financial year is the calendar year. The portfolio spans about 395 service station and convenience sites, with Viva Energy as the dominant tenant. Calendar-2026 guidance is for distributable Earnings of 17.14c, which is not a distribution figure.
Charter Hall Long WALE REIT (ASX:CLW)
CLW's 7.52% bar is almost indistinguishable from Waypoint's. It paid 25.50c per security, equal to operating earnings, across about 505 properties worth about $6.1bn with a 9.2-year WALE, and guides to 25.5c for FY2027.
The pack between 6.0% and 6.6%
Four fully franked company dividends and one trust distribution share this band, a mix of retail, resources, energy and property.
Harvey Norman Holdings Limited (ASX:HVN)
Leading the pack at 6.58%, Harvey Norman lifted fully franked dividends to 27.5c per share from 26.5c, while profit after tax and minority interests rose 2.0% to $528.46m. The 13.0c final has a Record Date of 7 October and is payable on 12 November 2026.
Fortescue Ltd (ASX:FMG)
Fortescue's 6.41% reflects an A$1.08 fully franked dividend, slightly below A$1.10 in FY2025, paid at 65% of underlying net profit after tax (NPAT) of US$3.5bn. Record shipments of 201.3 million tonnes supported the result, and the final is paid on 29 September 2026.
Metcash Limited (ASX:MTS)
Metcash's 6.34% comes from 18.0c per share fully franked for the year to 30 April 2026, a 73.6% payout ratio. The wholesaler supplies independent supermarkets including IGA, as well as liquor and hardware, and targets a payout of about 74%.
AGL Energy Limited (ASX:AGL)
AGL's 6.09% is based on 50c fully franked, 53.3% of underlying NPAT of $631m, which was down 2%. The Business is transitioning away from coal-fired generation.
Stockland (ASX:SGP)
Stockland sits at exactly 6.00%, on a 25.2c distribution that was 69% of FFO of 36.9c. FY2027 guidance keeps the distribution at 25.2c while lifting FFO to 38.0–39.0c.
The trailing bar
BWP Group (ASX:BWP)
BWP's 5.41% is the shortest bar. The Bunnings Warehouse landlord's 19.41c distribution was up 4.1%, and FY2027 guidance is 20.00c, the only guided payout among these ten that sits above its latest figure.
What the chart cannot show
A bar has height, not depth. It does not show how much of earnings is being paid out: CLW and Waypoint distributed what they earned, while BWP paid slightly more than FFO of 19.29c. It does not show balance sheets: HDN's gearing of 35.7% sits within a 30–40% target, Stockland's 22.7% within 20–30%. And it does not show direction. Guidance points lower for Arena, flat for HDN, CLW and Stockland, and higher for BWP.
Which risks sit outside the frame?
Tenant failure, finance costs, iron ore prices and Chinese steel Demand for Fortescue, and AGL's FY2027 profit guidance of $470m–$670m with a 55–60% target payout all have the potential to reshape future bars. Franking credits, excluded from every bar, can affect after-tax value for eligible Australian investors depending on their circumstances.
Why the tallest bar isn't automatically better
Bars grow when prices fall, and prices can fall when the market doubts a payout will last. The tallest bar here belongs to the name with the clearest reduction in guided income. Height measures one ratio on one day, not quality, growth, resilience or the likely direction of payouts.
What should investors monitor next?
Investors may want to monitor the Edge administration, Fortescue's final payment on 29 September, Harvey Norman's 7 October record date, Waypoint's quarterly distributions and FY2026 result, and where AGL's profit lands.
Key Insights / Key Takeaways
Run the same exercise next month and the bars will almost certainly look different, because prices move daily and guidance keeps being tested against results. The 2026 chart is a useful map of where ASX 200 income sits today, but past payouts, current indicative yields and future guidance each need to be read on their own terms.


 Nov 12, 2026





 Please wait processing your request...