
 CA
 NZ
 UK
 US
 IND

 AU

 Share
 X (Formerly Twitter)
 Whatsapp
 Facebook
 LinkedIn
 Telegram
 Email This Article
 Copy Link
 Summarize with AI
 Chat GPT
 Perplexity

Five Dividend stocks for five different income stories
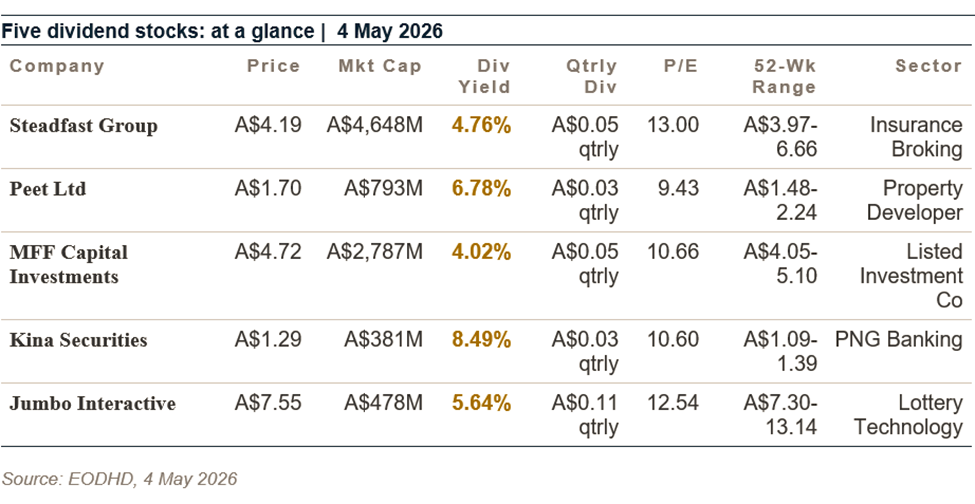
In an environment of elevated Equity valuations and persistently high living costs, income-generating equities have rarely been more sought-after. These five ASX-listed companies -- spanning insurance distribution, property development, listed Investment, Pacific banking and lottery technology -- offer Dividend yields ranging from 4.02 per cent to 8.49 per cent, backed by distinct and differentiated Business models.
The income investor's challenge in 2026 is not finding Yield -- cash rates and term deposits have normalised at levels competitive with equities -- but finding Yield that is sustainable, growing and accompanied by some Capital preservation potential. Dividend stocks that cut their distributions destroy Capital twice: first through the cut itself, and second through the share price re-rating that follows. Sustainability of the Dividend is therefore the primary analytical lens for each stock in this article.
The five stocks profiled here span a wide range of Business models, Dividend policy frameworks and risk profiles. Steadfast Group (ASX:SDF) pays a growing Dividend from a structurally defensive insurance broking Business. Peet Ltd (ASX:PPC) offers one of the highest yields in the property sector, backed by Australia's structural undersupply of residential land. MFF Capital Investments (ASX: MFF) pays a steady Dividend from a long-only global equities portfolio managed by a proven investor. Kina Securities (ASX: KSL) delivers the highest Yield on this list -- 8.49 per cent -- from a Papua New Guinea banking and financial services Franchise with genuine pricing power. Jumbo Interactive (ASX: JIN) pays from a highly cash-generative lottery technology Business with a growing international licensing pipeline.
|
|
|
Business Analysis |
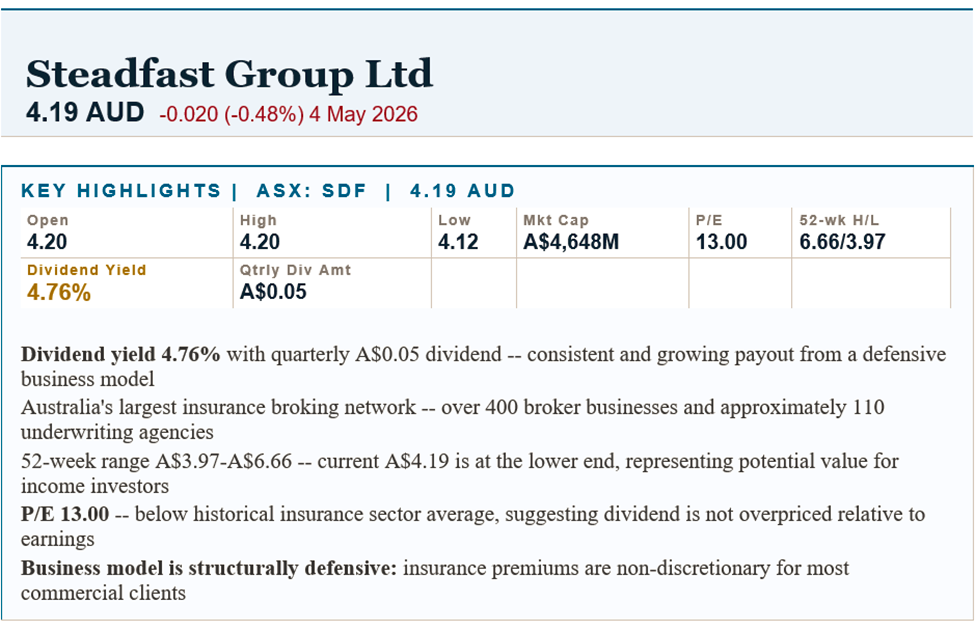
What Steadfast does: Steadfast Group Limited is Australia's largest general insurance broking network and a leading Underwriting agency group. The company operates a hub-and-spoke model: the Steadfast Network comprises over 400 independently owned insurance broker businesses that retain their independence but access Steadfast's scale advantages -- including preferential insurer relationships, technology platforms, professional Indemnity coverage, Marketing support and shared back-office services. Steadfast also owns a growing portfolio of Underwriting agencies that create and underwrite their own insurance products on behalf of capacity providers.
The insurance broking model is fundamentally defensive. Commercial insurance -- public Liability, professional Indemnity, property, motor fleet, workers compensation -- is non-discretionary for most Business operators. A client who lets their insurance lapse faces not just Financial Risk but potential legal exposure. This non-discretionary nature insulates Steadfast's Revenue from economic cycles to a significant degree: even when the economy slows, businesses continue to buy insurance.
Revenue model: Steadfast generates Revenue from network fees charged to member Brokers for the services and scale benefits provided, from Equity ownership stakes in a growing number of network Brokers (meaning it participates directly in their Earnings), and from its wholly-owned Underwriting agencies. The trend toward direct broker ownership is strategically significant: it converts Steadfast from a pure network operator (fee income) to a vertically integrated insurance services group (Equity-based Earnings).
Acquisition strategy: Steadfast has been a consistent acquirer of insurance broker businesses and Underwriting agencies, using its listed currency and strong Cash Flow to build scale. Each Acquisition adds Earnings, deepens the network, and typically generates a return on Capital that exceeds its cost. The Acquisition pipeline in Australian insurance broking remains long, with many mid-sized Brokers whose founders are approaching retirement considering a Steadfast transaction as a Liquidity and succession event.
|
|
Financial Analysis |
Steadfast's financial profile is that of a growing, highly cash-generative insurance services Business. Revenue has grown consistently through a combination of organic premium Volume growth (supported by the hard insurance market of recent years, with rate increases across most commercial lines) and acquisitions. Earnings per share growth has tracked Revenue growth closely, underpinning a progressive Dividend policy.
The Dividend at A$0.05 per quarter (A$0.20 annualised) represents a 4.76 per cent Yield on the current share price of A$4.19. The Payout Ratio -- dividends as a percentage of Earnings -- is moderate, leaving significant retained Earnings for Acquisition funding and organic growth Investment. This is the ideal structure for a Dividend growth investor: a Yield that is adequately covered by Earnings, with retained Earnings funding future growth that should sustain Dividend increases over time.
The Balance Sheet carries some Acquisition-related Debt, which is a standard feature of consolidating businesses. The quality of the Earnings base -- recurring, non-discretionary insurance premiums feeding through to broking commissions and Underwriting Margin -- provides strong Debt-service coverage.
|
|
Price Performance |
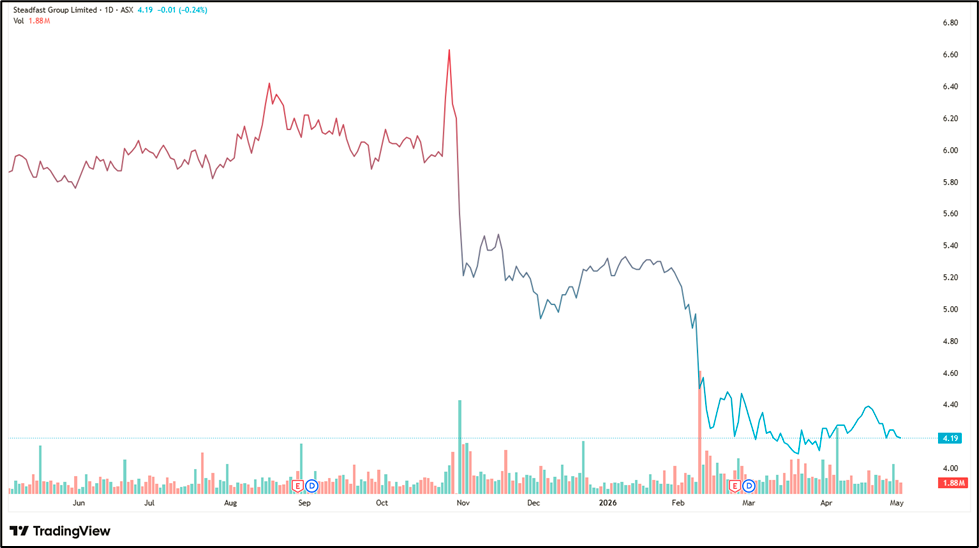
Steadfast's 52-week range of A$3.97 to A$6.66 is notably wide, implying the stock has experienced significant price Volatility over the past year. At A$4.19, the current price is near the lower end of the 52-week range -- approximately 37 per cent below the 52-week high. For income investors, this is relevant context: a stock trading well below its 52-week high may offer better value for a new entrant than one near its high, provided the Dividend is sustainable.
The share price decline from above A$6.00 to the current A$4.19 range likely reflects broader market re-rating of insurance-related equities and potentially specific Steadfast Earnings expectations. Income investors should research the reasons behind the price decline before entering, to distinguish between market-wide re-rating (which may be reversible) and fundamental Earnings deterioration (which may persist).
|
|
Valuation and Risks |
At P/E 13.00 and a 4.76 per cent Dividend Yield, Steadfast looks attractively valued relative to both the broader Australian Equity market and its own history. The P/E of 13 for a defensive, growing, highly cash-generative Business is below the typical valuation range for comparable insurance services companies. The Dividend Yield of 4.76 per cent provides a reasonable income return with the potential for Capital appreciation if the stock re-rates toward its 52-week high levels.
Key risks: A softening in the commercial insurance premium environment (a 'soft market') would reduce the Revenue flowing through Steadfast's network, potentially pressuring Earnings and the Dividend. Acquisition integration risk -- the strategy relies on successfully integrating acquired Brokers and agencies. Competition from global insurance broking groups (Aon, Marsh, Willis) for larger commercial accounts. Regulatory Risk across insurance broking compliance requirements.
|
|
Outlook |
The medium-term outlook for Steadfast is constructive. The commercial insurance market, while moderating from the hard market conditions of 2021-2023, remains broadly supportive, with premium rates holding at elevated levels across most commercial lines. The Acquisition pipeline continues to provide inorganic growth Options. The Underwriting agency Business -- higher-Margin than pure broking -- continues to grow as a proportion of group Earnings.
|
|
Frequently Asked Questions |
Q: Why is Steadfast's share price so far below its 52-week high?
A: At A$4.19 versus a 52-week high of A$6.66, the stock is approximately 37% below its recent peak. This likely reflects a combination of market-wide re-rating of financial sector stocks and potentially revised Earnings expectations. Income investors should assess whether the Dividend (A$0.05 quarterly) remains covered by Earnings.
Q: Is the 4.76% Dividend Yield sustainable?
A: At P/E 13.00 and a moderate Payout Ratio, the Dividend appears adequately covered by Earnings. Steadfast's non-discretionary insurance broking Revenue model provides defensive Earnings support.
Q: What is Steadfast's core Business?
A: Australia's largest general insurance broking network -- over 400 broker businesses accessing Steadfast's scale, plus growing Underwriting agencies. Revenue is earned from network fees, broker ownership stakes and Underwriting margins.
|
|
Business Analysis |
What Peet does: Peet Limited is one of Australia's most established residential land developers, creating master-planned communities -- large-scale subdivisions of hundreds to thousands of residential lots -- across Western Australia, Queensland, New South Wales, Victoria and South Australia. The company's Business spans the full residential land development cycle: land Acquisition, planning and approval, civil infrastructure (roads, drainage, services), lot titling, and sales to residential home builders and direct buyers.
Peet operates through three primary Business models. In its own-account development projects, Peet owns the land, develops it and sells lots directly -- the highest-Margin model. In its funds management operations, Peet manages land development projects on behalf of co-investors through managed trusts -- earning management fees, development margins and performance fees without the full Balance Sheet exposure. In its joint ventures, Peet partners with landowners or institutional investors on development projects, sharing Capital, risk and return.
The structural Demand case: Australia is experiencing one of the most severe residential housing undersupply crises in its history, driven by rapid population growth (net overseas migration running at record levels), constrained land Supply (planning and approval bottlenecks), and insufficient construction industry capacity. Peet's master-planned communities provide greenfield residential land Supply precisely where Demand is growing -- in the urban growth corridors of Australia's major cities. This structural Demand backdrop is the most powerful long-term support for Peet's Earnings and Dividend.
|
|
Financial Analysis |
Peet's financial results are characterised by Revenue lumps that follow land settlement cycles. Unlike a Business with monthly service Revenue, Peet's Revenue is recognised when land lots settle (transfer to the buyer). A settlement-heavy period produces strong Revenue and Earnings; a slower settlement period produces weaker results. This creates Earnings variability that, over a full property cycle, averages to a strong underlying Earnings stream -- but that can mislead investors looking at single-year results.
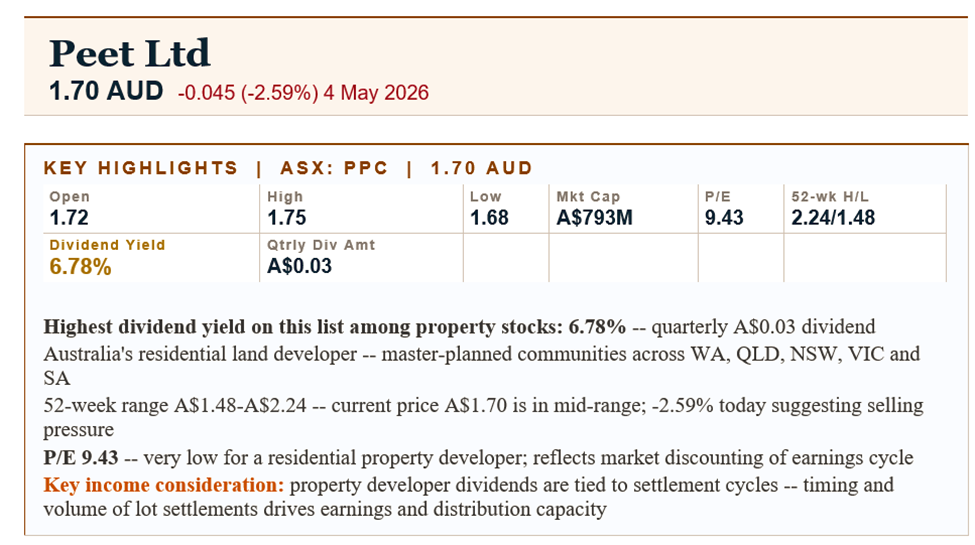
The Dividend of A$0.03 per quarter (A$0.12 annualised) at A$1.70 provides a 6.78 per cent Yield. At P/E 9.43, the Earnings Yield is approximately 10.6 per cent -- significantly above the Dividend Yield, indicating the Payout Ratio leaves substantial Earnings retained. This retained Earnings base funds land Acquisition and development pipeline, the Capital-intensive Investment required to sustain future settlement volumes.
Peet's Balance Sheet carries development-stage land Assets (properties under development and completed lots awaiting settlement) and associated Debt. The net Tangible Asset (NTA) per share is the most important Balance Sheet metric for a property developer -- it represents the value of the underlying land and development Assets relative to the Debt structure. Peet's NTA has historically been close to or above its share price, suggesting the stock offers land asset value alongside income.
|
|
Price Performance |
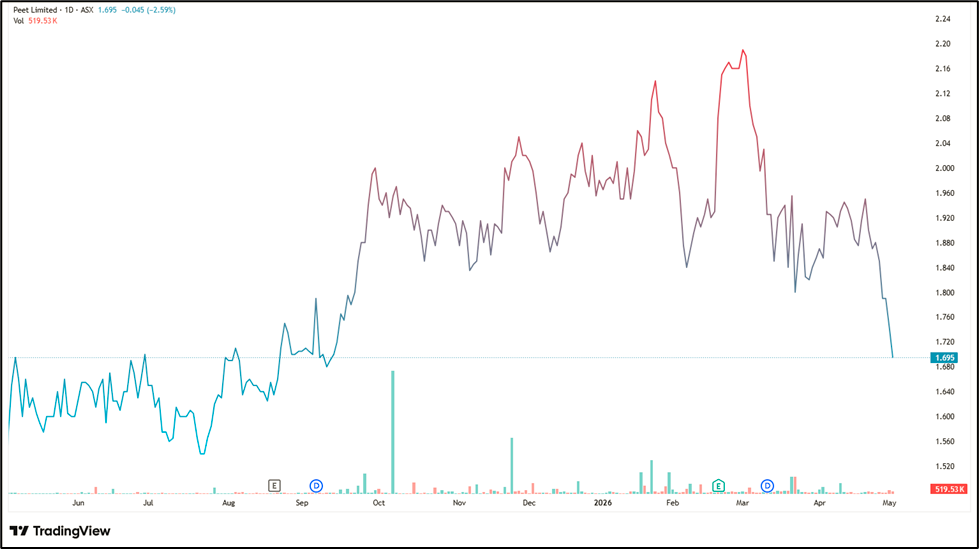
Peet's 52-week range of A$1.48 to A$2.24 shows a stock that has re-rated significantly from its highs. The -2.59 per cent move on 4 May 2026, on a day when the stock declined from A$1.74 open to an A$1.68 low, suggests ongoing selling pressure. Income investors who prioritise Yield sustainability over near-term price performance may view the current level as acceptable entry for a 6.78 per cent Dividend Yield -- but should be comfortable holding through continued Volatility. [EODHD, 4 May 2026]
|
|
Valuation and Risks |
At P/E 9.43 and a 6.78 per cent Yield, Peet offers value-oriented income appeal. The P/E of 9.43 for a residential land developer in Australia's most acute housing undersupply environment in decades appears low -- the market is pricing in ongoing Earnings uncertainty related to interest rates (which affect Demand for new housing) and settlement timing rather than structural Business deterioration.
Key risks: Interest Rate sensitivity is the primary risk: higher Mortgage rates reduce the pool of potential lot buyers, slowing settlement rates and reducing Earnings. Planning and approval delays can extend the time from land Acquisition to Revenue recognition. Construction cost Inflation increases the cost of civil infrastructure, compressing development margins. The A$79 million market cap reflects micro-cap Liquidity risk: Peet has limited institutional coverage and thin daily trading Volume.
|
|
Outlook |
Australia's housing undersupply crisis shows no signs of abating. Population growth has been running at record levels, new dwelling completions remain well below the government's 1.2 million homes target, and land Supply in major urban growth corridors is constrained by planning approval processes. This structural backdrop supports sustained Demand for Peet's master-planned residential lots, providing a positive medium-term Earnings and Dividend outlook subject to Interest Rate and settlement timing variability. [PPC Annual Report FY2024, Outlook]
|
|
Frequently Asked Questions |
Q: Why is Peet's Dividend Yield so high at 6.78%?
A: The combination of a depressed share price (near the lower end of the 52-week range) and a consistent quarterly Dividend creates an elevated Yield. At P/E 9.43, the market is pricing in Earnings uncertainty, but the absolute Yield reflects real income from a Business with structural Demand tailwinds.
Q: How does Peet generate income to pay dividends?
A: From residential lot settlements: the profit earned when developed lots transfer to homebuilders and direct buyers. Settlement Volume and Margin drive Earnings, which in turn support the quarterly Dividend.
Q: What is the biggest risk to Peet's Dividend?
A: A sustained slowdown in lot settlements -- most likely caused by high interest rates reducing housing affordability and Demand. If settlement volumes fall materially, Earnings and thus the Dividend could come under pressure.
|
|
Business Analysis |
What MFF Capital is: MFF Capital Investments Limited is an ASX-listed Investment company (LIC) that invests in listed global equities using a long-only, concentrated, value-oriented approach. The company is managed by Christopher Mackay, one of Australia's most experienced and respected global Equity investors. MFF's Investment philosophy focuses on owning high-quality businesses with durable competitive advantages, strong returns on Capital, and management teams with a long-term owner-operator orientation -- businesses it intends to hold for many years rather than trade frequently.
The portfolio is concentrated: MFF typically holds 20-30 positions rather than the 50-100 positions common in index-aware funds. This concentration reflects genuine conviction and creates a portfolio whose performance is meaningfully differentiated from the global Equity benchmark. In years when MFF's high-quality, value-oriented positions outperform, the returns can be substantially above benchmark; in years when Growth Stocks dominate, MFF may lag.
The LIC structure and Dividend: As a listed Investment company, MFF earns income from dividends and interest received on its portfolio holdings, plus realised gains from the sale of investments. This Investment income funds the quarterly Dividend. The LIC structure also means the MFF share price can trade at a premium or discount to net Tangible Asset (NTA) value -- the value of the underlying portfolio per share. When MFF trades at a discount to NTA (i.e. its share price is below the per-share value of its investments), investors are effectively buying the portfolio at below its Intrinsic Value.
|
|
Financial Analysis |
MFF's Revenue consists of Investment income (dividends and interest from portfolio companies) and realised Capital gains from portfolio transactions. The Dividend of A$0.05 per quarter (A$0.20 annualised) is funded from this Investment income. The ability to sustain this Dividend depends on the portfolio generating sufficient realised income -- a function of the Dividend Yield and Rebalancing activity within the portfolio.
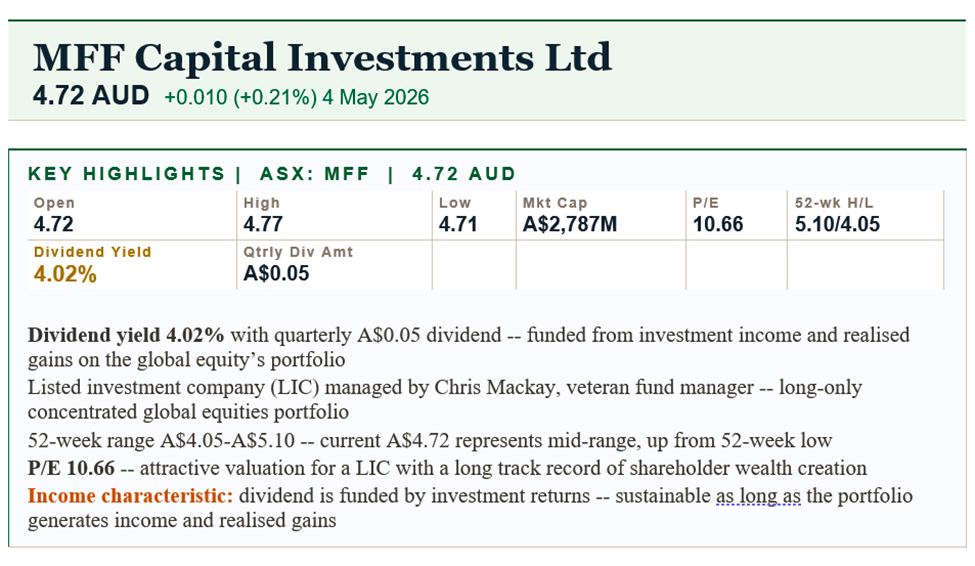
At a share price of A$4.72 and P/E of 10.66, MFF offers a 4.02 per cent Dividend Yield alongside global equities exposure. The NTA per share (disclosed in monthly NTA updates on the ASX) is the primary metric for assessing value: if NTA is above A$4.72, the stock is trading at a discount to asset value, which is attractive for a new investor; if below, the stock is at a premium.
MFF's cost structure is very lean: as a LIC rather than a Fund Manager, it does not have a large employee base or distribution network. Management fees paid to the Investment manager are the primary operating cost. This lean structure means the vast majority of portfolio returns flow through to shareholders rather than being absorbed by operational costs.
|
|
Price Performance |
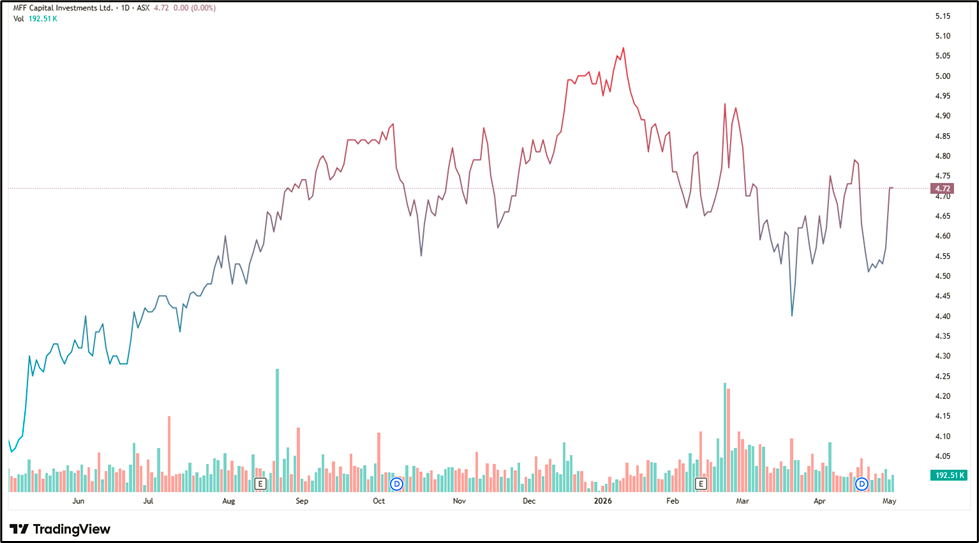
MFF's 52-week range of A$4.05 to A$5.10 shows the stock has declined from its highs but is recovering. The current A$4.72 price, up A$0.01 (+0.21 per cent) on 4 May 2026, suggests mild positive momentum. The range of roughly A$1.05 between the 52-week high and low represents approximately 20 per cent Volatility -- consistent with a listed Investment company whose NTA moves with global Equity markets.
|
|
Valuation and Risks |
The correct valuation framework for MFF is NTA-based rather than P/E based. The P/E of 10.66 reflects the Earnings generated by the portfolio; the NTA reflects the underlying portfolio value. Income investors should compare the Dividend Yield of 4.02 per cent with the alternative of investing in global equities directly -- MFF provides a professionally managed, concentrated global equities exposure with a quarterly cash Dividend, which many retail income investors cannot easily replicate.
Key risks: Global Equity Market Risk is the primary risk -- a material global Equity market correction reduces NTA and potentially forces the company to reduce the Dividend. Currency risk: MFF's portfolio is predominantly in USD and EUR, so AUD appreciation reduces the NTA in AUD terms without any change in the underlying businesses. Concentration risk: a concentrated portfolio means single-stock decisions have greater impact than in a diversified fund. Discount risk: LICs can trade at persistent discounts to NTA if investor sentiment toward the structure or manager deteriorates.
|
|
Outlook |
MFF's outlook is tied to global Equity market conditions, the performance of its concentrated portfolio companies, and the AUD/USD Exchange Rate. The Investment manager's long-term track record provides confidence in the quality of the portfolio selection process. For income investors seeking global Equity exposure with a consistent quarterly Dividend, MFF provides a differentiated option at an accessible share price. [MFF Annual Report FY2024]
|
|
Frequently Asked Questions |
Q: What is MFF Capital and how is it different from a managed fund?
A: MFF Capital is a listed Investment company (LIC) -- it is listed on the ASX like any share, you buy and sell it like a stock, and it pays quarterly dividends from its Investment income. Unlike a managed fund, you don't invest a fixed dollar amount per unit price -- you buy shares at Market Price, which may be above or below the underlying asset value (NTA). [Source: MFF Annual Report FY2024]
Q: Who manages MFF's portfolio?
A: Christopher Mackay, a veteran Australian global Equity investor, is the principal manager. MFF has been managed by the same Investment team since listing, providing continuity of Investment philosophy. [Source: MFF Annual Report FY2024]
Q: What drives the Dividend?
A: Investment income from MFF's portfolio holdings (dividends received from portfolio companies) plus realised gains from portfolio activity. The Dividend is not guaranteed -- it depends on the portfolio generating sufficient distributable income. [Source: MFF Annual Report FY2024, Dividend Policy]
|
|
Business Analysis |
What Kina Securities does: Kina Securities Limited is a Papua New Guinea-based financial services group that operates Kina Bank -- one of Papua New Guinea's major banks -- alongside Wealth Management, Superannuation (the PNG equivalent), fund management and stockbroking operations. Kina Bank provides retail banking, Business banking, treasury and trade finance services to individuals, small and medium businesses, corporate clients and government entities across PNG.
PNG's banking sector is characterised by high net interest margins -- the spread between lending rates and deposit rates -- that are structurally wider than in developed economies. This reflects the higher Credit risk premium required in an emerging market, the limited competition relative to the market size, and the higher cost of operating banking infrastructure across PNG's geographically challenging terrain (mountains, rivers, remote communities). Kina benefits from these structural Economics as an established operator with a national branch and agency network.
Financial inclusion opportunity: PNG has a population of approximately 10 million, of whom a significant majority remain unbanked or underbanked -- without access to formal financial services. The expansion of mobile money, agency banking and digital financial services is gradually bringing more of the population into the formal financial system, representing a Long-term Growth opportunity for Kina as a major licensed bank with existing infrastructure.
Wealth Management and Superannuation: Beyond banking, Kina manages substantial Superannuation (Nasfund) and Wealth Management Assets on behalf of PNG individuals and institutions. These businesses generate fee income that complements the bank's net interest income, providing Diversification within the PNG financial services market.
|
|
Financial Analysis |
Kina's financial profile is that of a profitable, cash-generative regional bank in an emerging market. Net interest Margin (NIM) -- the spread between average lending rates and average deposit rates -- is the primary driver of Earnings. PNG's NIM environment is structurally favourable: PNG Kina deposit rates are relatively low while lending rates remain elevated, reflecting the risk premium in the economy and the limited availability of alternative Credit sources for PNG borrowers.
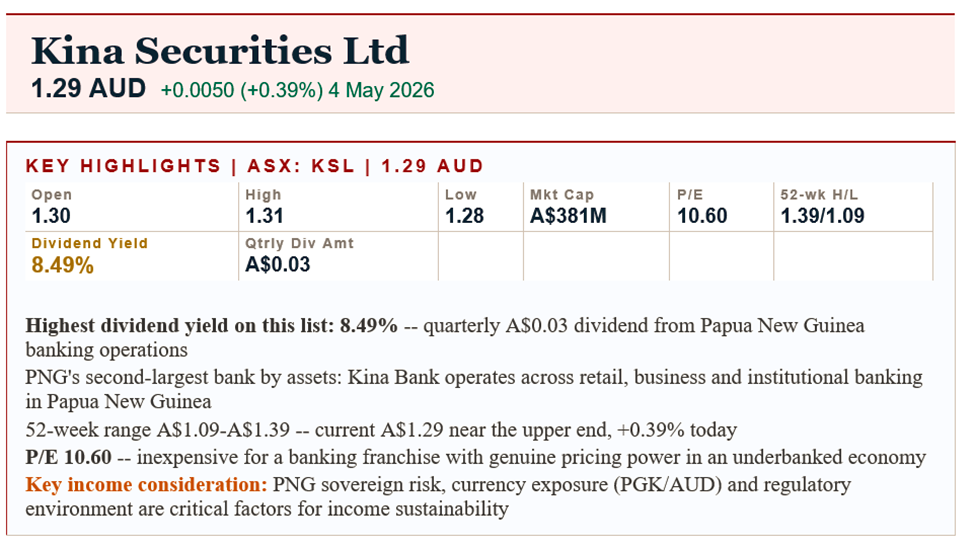
The Dividend of A$0.03 per quarter (A$0.12 annualised) represents an 8.49 per cent Yield at the current A$1.29 share price. At P/E 10.60, the Earnings Yield is approximately 9.4 per cent -- indicating the Dividend is covered approximately 1.1 times by Earnings. This coverage is adequate but not particularly generous, meaning any Earnings pressure would directly constrain Dividend capacity.
Capital adequacy is a critical financial metric for any bank. Kina operates under the supervision of the Bank of Papua New Guinea (BPNG) and must maintain minimum Capital ratios. The bank's Capital position -- reported quarterly and annually -- provides the regulatory buffer that determines both lending capacity (higher Capital supports more Loan growth) and Dividend capacity (surplus Capital above minimums can be distributed).
|
|
Price Performance |
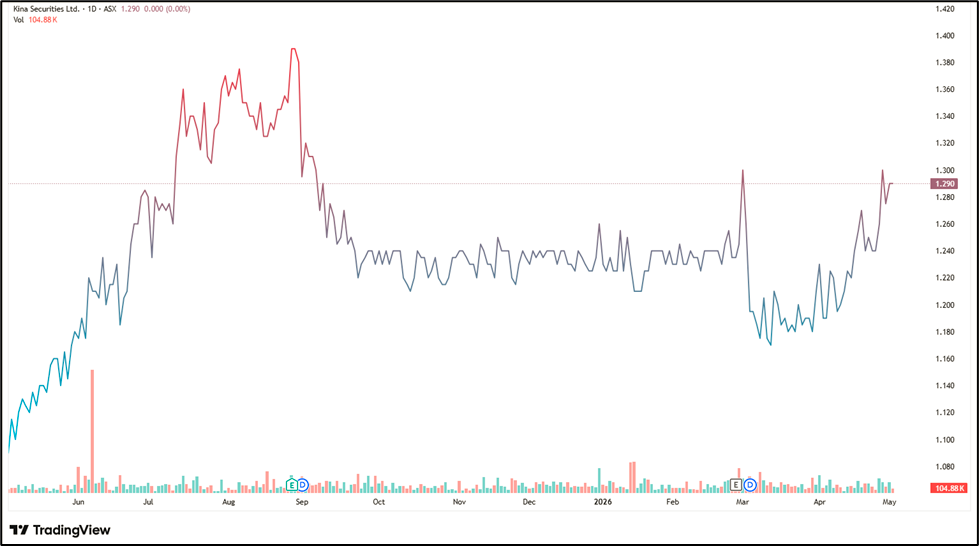
Kina's 52-week range of A$1.09 to A$1.39 shows relatively modest Volatility for a small-cap stock, reflecting its stable cash-generative banking Business. At A$1.29 and +0.39 per cent on 4 May 2026, the stock is near the upper end of its 52-week range -- a positive signal that contrasts with the downward pressure seen in some of the other stocks on this list.
|
|
Valuation and Risks |
At P/E 10.60 and an 8.49 per cent Dividend Yield, Kina represents the most aggressive income play on this list. The combination of high Yield, low P/E and emerging market banking exposure is a classic value-plus-income profile -- attractive to investors willing to underwrite the associated risks.
Key risks: PNG sovereign risk is the dominant consideration. Political instability, regulatory changes, currency controls, or broader economic deterioration in PNG would directly impact Kina's Earnings and its ability to remit dividends to Australian shareholders. Currency risk: Kina earns in Papua New Guinea Kina (PGK) and pays dividends in AUD -- PGK Depreciation reduces the AUD value of Earnings. Credit risk: in an emerging market banking environment, Loan defaults can rise rapidly in economic downturns. Liquidity risk: ASX: KSL at A$38 million market cap has very limited Liquidity. The micro-cap status means bid-ask spreads are wide and position-building or exit is constrained.
|
|
Outlook |
PNG's economic growth is tied to its resource sector (LNG, gold, copper, agricultural commodities), infrastructure Investment and government spending. The medium-term outlook for PNG's economy is generally positive -- LNG project revenues provide a stable government income base and support domestic economic activity. For Kina, the primary growth driver is Loan book expansion as PNG's economy grows and financial inclusion deepens.
The 8.49 per cent Dividend Yield rewards investors for the sovereign and Liquidity risk premium. For income investors who have conducted thorough Due Diligence on PNG-specific risks and are comfortable with an Illiquid position in a Pacific island banking Franchise, Kina offers the highest Yield on this list with a Business model that is genuinely profitable and cash-generative.
|
|
Frequently Asked Questions |
Q: Why is Kina Securities' Dividend Yield so high at 8.49%?
A: The elevated Yield reflects the combination of consistent Earnings (PNG banking is profitable), a low share price (reflecting the PNG sovereign risk discount the market applies to the stock), and a consistent quarterly Dividend policy. Higher Yield = higher risk; in Kina's case, the risk is PNG-specific.
Q: What is Kina Bank and where does it operate?
A: Kina Bank is one of Papua New Guinea's major banks, providing retail and Business banking services across PNG. It is supervised by the Bank of Papua New Guinea (Central Bank).
Q: What are the main risks for Australian investors in KSL?
A: PNG sovereign risk (political stability, regulatory environment), currency risk (PGK/AUD Exchange Rate), micro-cap ASX Liquidity (A$38M market cap means thin daily trading Volume), and Dividend coverage (Payout Ratio leaves limited buffer for Earnings compression).
|
|
Business Analysis |
What Jumbo Interactive does: Jumbo Interactive Limited operates in two distinct but related segments. In Australia, the company operates Oz Lotteries -- the country's leading online lottery ticket reseller -- through a commercial arrangement with Tabcorp, Australia's licensed lottery operator. Internationally, Jumbo provides its lottery management system (the SaaS platform underlying Oz Lotteries) to lotteries and charities around the world under licensing agreements, earning recurring Software-as-a-Service (SaaS) Revenue.
The Australian Business is simple and lucrative: Jumbo sells Powerball, Lotto, Oz Lotto and other Tabcorp lottery tickets online, earning a commission on each ticket sold. As Australia has shifted from physical retail lottery ticket sales toward digital channels, Jumbo has captured a growing share of the total lottery Revenue pool without the Capital Investment of the underlying lottery infrastructure. The Business requires no physical retail estate, limited staff, and generates very high operating Cash Flow per dollar of Revenue.
International SaaS licensing: The more strategically interesting segment is Jumbo's international lottery management system licensing Business. The company licenses its lottery platform to charities, lotteries and gaming organisations around the world, charging a recurring SaaS licence fee based on ticket sales volumes. This model exports the technology underlying Oz Lotteries without the Margin compression of the Australian reseller model -- Jumbo earns a percentage of all ticket Revenue run through its platform, with no ticket procurement costs.
Charity lottery segment: Jumbo also provides lottery management services to the Australian charity sector, running online lottery campaigns for charities that use lottery as a fundraising mechanism. This segment leverages the same underlying technology platform as the commercial lottery Business and generates fee income from charities that outsource their lottery management.
|
|
Financial Analysis |
Jumbo's financial profile is exceptional for its size. The combination of high-Volume, low-cost online lottery ticket reselling and growing SaaS licence fee income produces very high operating margins and strong free Cash Flow conversion. The Business is asset-light: it requires technology Investment rather than physical Capital, and once the technology platform is built, incremental Revenue requires minimal incremental cost.
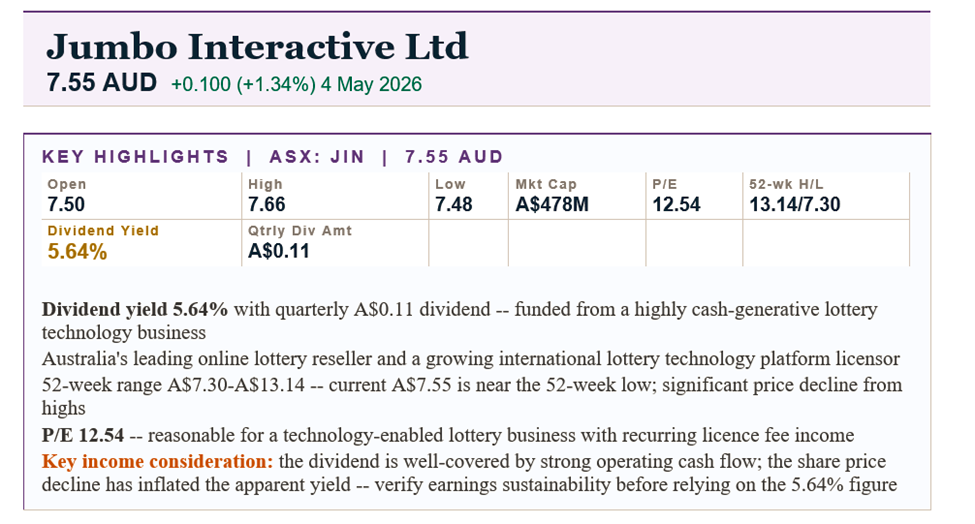
The Dividend of A$0.11 per quarter (A$0.44 annualised) at A$7.55 produces a 5.64 per cent Yield. At P/E 12.54, the Earnings Yield is approximately 8.0 per cent -- indicating a Payout Ratio of approximately 70 per cent (5.64 divided by 8.0). This is a relatively high Payout Ratio for a technology company, reflecting management's confidence in the cash-generative nature of the Business and its commitment to income investors.
The significant gap between the 52-week high (A$13.14) and current price (A$7.55) -- a decline of approximately 43 per cent -- has mathematically elevated the Dividend Yield. Investors must distinguish between a Yield elevated by genuine Earnings growth (sustainable) and a Yield elevated by share price decline (potentially misleading). At P/E 12.54, the Earnings are currently real, but investors should assess whether the Earnings base used to set the Dividend is sustainable going forward.
|
|
Price Performance |
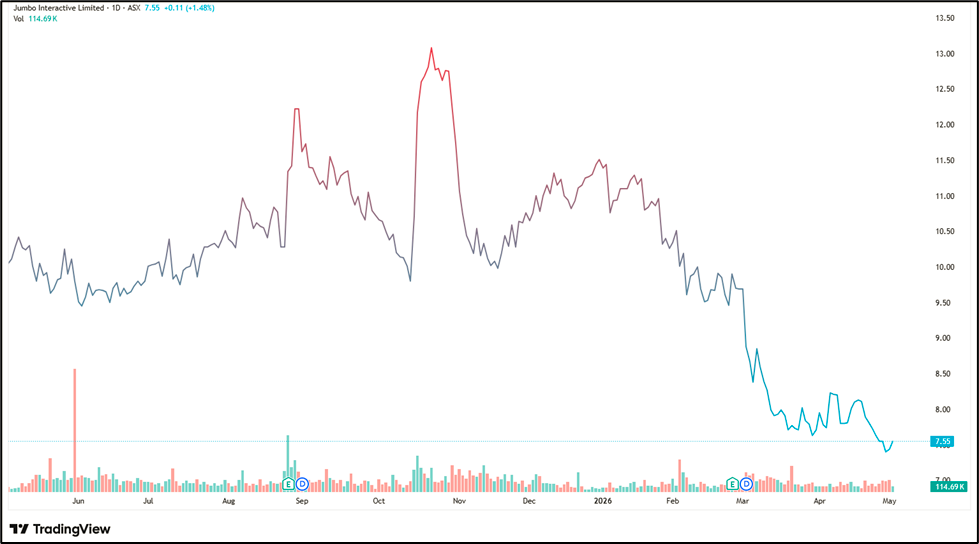
Jumbo's 52-week range of A$7.30 to A$13.14 is the widest on this list in percentage terms -- approximately 80 per cent between low and high. The current price of A$7.55 is near the 52-week low, suggesting the stock has de-rated materially from its highs. The +1.34 per cent positive move on 4 May 2026 (from A$7.50 open to A$7.55 close) is a tentative positive sign on an otherwise challenging price performance chart.
For income investors, the key question raised by this significant price decline is: has something changed in the Business that justifies a 43 per cent re-rating, or has the market over-corrected? The P/E of 12.54 and the maintained Dividend suggest the Earnings base is currently intact -- but income investors should examine the most recent half-year report and any Earnings guidance updates before relying on the current Yield as a reliable forward income figure.
|
|
Valuation and Risks |
At P/E 12.54 and 5.64 per cent Yield, Jumbo offers a combination of technology company Earnings quality (high margins, asset-light, strong cash conversion) and income stock cash returns. The challenge is reconciling this attractive current metrics profile with the 43 per cent share price decline from the 52-week high -- which implies the market has materially revised down its expectations for future Earnings growth.
Key risks: The commercial relationship with Tabcorp is the central Business risk -- the Australian lottery reseller Business depends on a continuing, commercially favourable arrangement with Tabcorp (the Tabcorp relationship has historically come up for renegotiation and the terms can change materially). International SaaS growth execution risk: expanding the lottery platform internationally requires winning and onboarding new customers, which takes time and Investment. Regulatory Risk: online lottery and gaming regulation varies by Jurisdiction and can change. Competitive risk from direct-to-consumer lottery platforms launched by Tabcorp itself.
|
|
Outlook |
Jumbo's strategic direction is increasingly toward international SaaS Revenue, which carries higher margins and better growth prospects than the Australian reseller Business. Each new international lottery or charity SaaS client adds recurring, growing Revenue with limited incremental cost. The company has been investing in Business development and customer success capabilities to accelerate international adoption.
The Dividend sustainability question resolves around the Tabcorp relationship and SaaS Revenue growth. If SaaS Revenue continues to grow and the Tabcorp relationship remains commercially stable, the Earnings base supports the current A$0.44 annual Dividend. If either deteriorates, Dividend capacity could be affected. Given the significant price decline from A$13.14 highs, the market appears to have already priced in some concern on these dimensions -- creating a potential opportunity for investors who believe the base case Earnings are more durable than the market currently implies.
|
|
Frequently Asked Questions |
Q: What does Jumbo Interactive do?
A: Jumbo operates Oz Lotteries (Australia's leading online lottery reseller, selling Tabcorp tickets for a commission) and licences its lottery management platform to international lotteries, charities and gaming organisations as a SaaS product earning recurring licence fees.
Q: Why has Jumbo's share price fallen so far from its highs?
A: From A$13.14 (52-week high) to A$7.55 (current) represents approximately a 43% decline. This likely reflects revised expectations for Earnings growth in the Australian Business and the pace of international SaaS adoption. Income investors should assess whether current P/E 12.54 Earnings are sustainable before relying on the 5.64% Yield.
Q: Is the 5.64% Dividend Yield sustainable?
A: At P/E 12.54 and an implied Payout Ratio of approximately 70%, the Dividend is currently covered by Earnings. The key risk is whether Earnings are maintained -- particularly if Tabcorp renegotiates the reseller agreement or international SaaS growth disappoints.
Q: What is the Tabcorp risk?
A: Jumbo's Australian Business depends on a commercial arrangement with Tabcorp for the right to resell its lottery products online. The terms of this arrangement, including commission rates, periodically come up for renewal or renegotiation. Any material change to these terms would directly affect Jumbo's Australian Revenue and Earnings.
COMPARATIVE ANALYSIS: WHICH Dividend STOCK SUITS WHICH INVESTOR?
Matching Dividend stocks to income investor profiles
Not all 4-9 per cent yields are equal -- the sustainability, growth trajectory and risk attached to each Dividend determines which stock best serves each investor's income objectives.
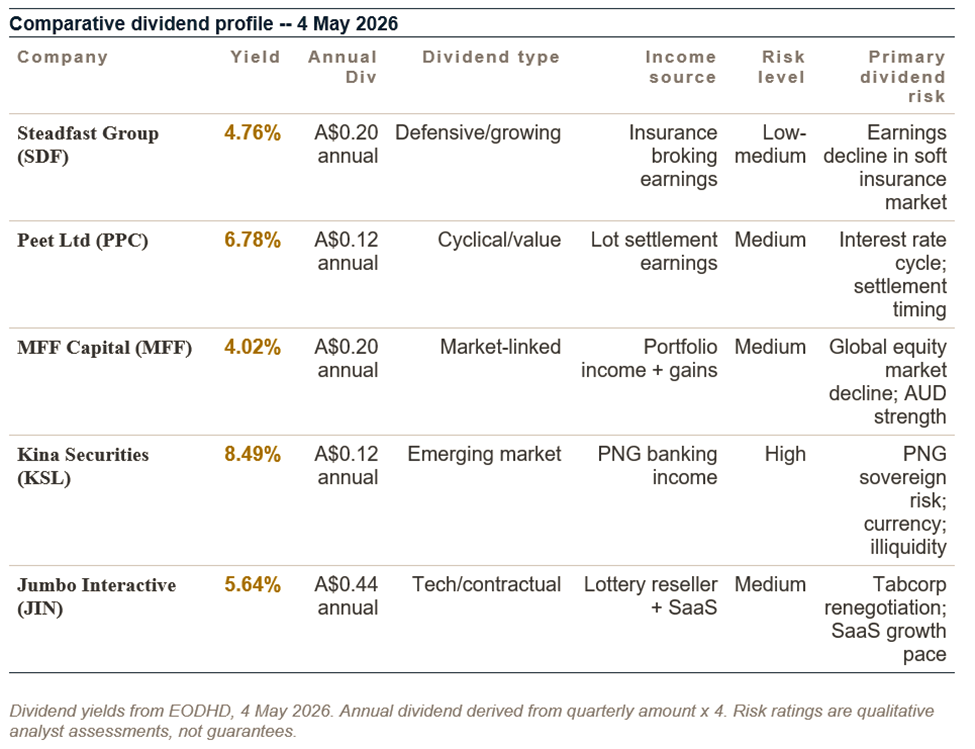

For the defensive income investor: Steadfast Group (SDF) at 4.76 per cent offers the most defensible income stream -- non-discretionary commercial insurance is as Recession-resistant as Dividend income sources get. The P/E of 13 and significant share price decline from highs creates a potential value opportunity alongside the income.
For the highest-Yield seeker: Kina Securities (KSL) at 8.49 per cent is the only stock on this list offering a genuinely high income return, but it comes with PNG sovereign risk and micro-cap illiquidity that makes it unsuitable for risk-averse income investors. Suitable only for investors with specific knowledge of the PNG banking environment and tolerance for a position they may not easily exit.
For the property-income investor: Peet Ltd (PPC) at 6.78 per cent plays into Australia's structural housing undersupply thesis while delivering income. The cyclical nature of developer Earnings requires more active monitoring than a Utility-style income stock, but the long-term structural Demand backdrop is compelling.
For the global Equity income exposure: MFF Capital (MFF) at 4.02 per cent is the lowest Yield on the list but provides exposure to a concentrated global equities portfolio managed by an experienced investor. For income investors seeking international Diversification within their Dividend portfolio, MFF offers a differentiated option.
For the technology-enabled income play: Jumbo Interactive (JIN) at 5.64 per cent offers technology company Margin quality (high cash conversion, asset-light) with an income stock distribution profile. The significant price decline from highs either represents a buying opportunity or a warning signal -- investors should form a view on the Tabcorp relationship and international SaaS growth trajectory before committing Capital.


 Nov 12, 2026





 Please wait processing your request...