Westpac Banking Corporation
The External environment is challenging but the outlook looks stable: Westpac Banking Corporation (ASX: WBC) is a large-cap stock with the market capitalization of circa $86.33 Bn as of January 02, 2019. They provide a broad range of banking and financial services which includes consumer, business and institutional banking and wealth management services. FY18 was a challenging year for the financial service sector in Australia as there was intense scrutiny from Government, regulators, the media, and the community in general. Due to this environment in which they operate have reinforced the need to deliver better customer outcomes and experiences. Throughout 2018, they continued to focus on seeking to deliver positive outcomes for its customers and shareholders through a service revolution transformation strategy. On the other hand, the company has recently announced the distribution of $0.7106 per security for SFI (Self-Funding Instalments) over securities in Vanguard Australian Shares Index ETF (VAS) as mentioned in PDS (Product Disclosure Statement) and dividends will be applied to reduce the Completion Payment of the SFIs and will be paid on or about 17 January 2019 with the ex-distribution/ entitlement date of 02 January 2019 and record date of 03 January 2019.
From the financial front, the net profit attributable to Westpac Banking Corporation for the year was $8,095 million, which represent an increase of $105 million or 1% compared to 2017. Operating expenses were $9,692 million, which represents an increase of $258 million or 3% compared to 2017. The increase in operating expenses included annual salary increases and higher technology expenses which are related to the Group’s investment program, an increase in regulatory and compliance costs and costs associated with the exit of the Hastings business. Although these increases were partially offset by productivity benefits and lower amortization of intangibles. Impairment charges were $710 million, a decrease of $143 million or 17% compared to 2017. The decrease in impairment charges was primarily due to reduced individual provisions on larger facilities. Asset quality remains strong, with stressed exposures as a percentage of total committed exposures at 1.08%, up 3 basis points over the year. The bank’s Net Interest Margin (NIM) grew marginally from 2.06% to 2.13% (YoY). Total equity to total assets increased marginally from 7.2% to 7.3% (YoY). Total capital ratio grew marginally from 14.82% to 14.74% (YoY).
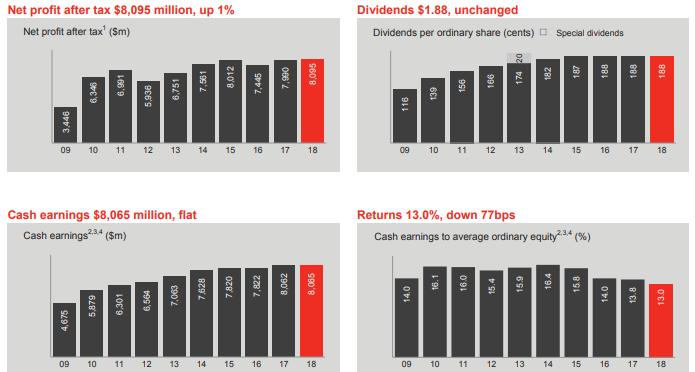
Key Financial Metrics (Source: Company Reports)
In our view,the bank has a brighter outlook as it remains focuses on executing its vision of being one of the world’s great service companies by maintaining the performance discipline by continuing to be prudent in the management of capital, funding, and liquidity. As of now, the bank is seeking to achieve a ROE between 13% and 14% and reduction of the Group’s cost to income ratio below 40%. On the other hand, wealth and small to medium business enterprises will continue to be focused on growing funds on the Group’s wealth management system by using new technologies which makes business banking even easier to access for its customers. Meanwhile, the share has fallen 14.19% in the past six months as at December 31, 2018 and is trading towards the lower range.The stock has PE multiple of 10.54x and P/BV of 1.3x, representing undervalued at the current juncture. Hence, we maintain our “Buy” recommendation on the stock at the current market price of $24.480
National Australia Bank Limited
Trading at Reasonable Level: National Australia Bank Limited (ASX: NAB) is a 160 years old Australia’s leading bank serving more than 9 million customers through its branches located at more than 900 locations over the continent. By working with small, medium and large businesses, the bank supports them through every stage of the business lifecycle.
On 24 December 2018, the bank declared its dividend for the NABPC - CAP NOTE 3-BBSW+3.50% PERP NON-CUM RED T-03-20 security. The bank will distribute a dividend of $0.9738 per share to its shareholders. The Ex-date is 14 March 2019, record date is 15 March 2019, and the payment date is 25 March 2019. The total dividend/distribution rate for the period is recorded at 3.9606% per annum with the dividend/distribution margin of 3.50%.
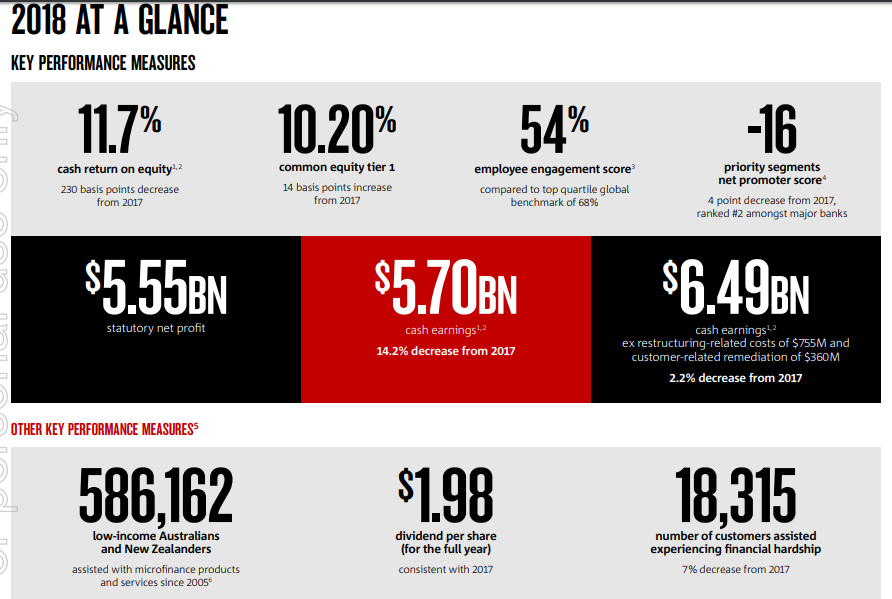
FY18 Financial Highlights (Source: Company Reports)
Over the past five years, the margins of the bank have declined. During FY18, the bank reported a net interest margin of 1.86% which was below the industry median of 1.94%. The efficiency ratio was in line with the industry at 51.9%, but it has declined by 17.2% over the past five years. The bank reported loan growth of 5.2% which was again below the industry median of 12.5%. The bank reported negative deposit growth of 1.1% whereas the industry reported positive growth of 5.8%. Tier 1 Risk-Adjusted Capital Ratio was reported at 12.38% which has improved over the past 5-years and is above the industry median of 11.13%. The bank has ~2.78 billion shares outstanding with the market cap of $66.85 billion (as on 2 January 2019) and a beta of 1.21x (5-Year Monthly basis). We presume that the bank has decent outlook as it focuses on building a more sustainable business through exceptional customer services, prudent investment towards customer satisfaction, and improving its core business in years to come. Meanwhile, the stock has generated negative YTD return of 18.60% and is trading at the same P/E of 10.5x as compared to the banking industry median P/E of 10.5x. Today, the stock is down by 1.828% as compared to the previous close, currently trading at the price of level $23.630, and is creating new support levels on a regular basis. The stock is positioned near to the Simple Moving Average (SMA) level of the Bollinger band and is in the average position of the Relative Strength Index (RSI). Based on foregoing, we, therefore, maintain our “Buy” recommendation over the stock at the current market price of $23.630.
Disclaimer
The advice given by Kalkine Pty Ltd and provided on this website is general information only and it does not take into account your investment objectives, financial situation or needs. You should therefore consider whether the advice is appropriate to your investment objectives, financial situation and needs before acting upon it. You should seek advice from a financial adviser, stockbroker or other professional (including taxation and legal advice) as necessary before acting on any advice. Not all investments are appropriate for all people. Kalkine.com.au and associated pages are published by Kalkine Pty Ltd ABN 34 154 808 312 (Australian Financial Services License Number 425376). The information on this website has been prepared from a wide variety of sources, which Kalkine Pty Ltd, to the best of its knowledge and belief, considers accurate. You should make your own enquiries about any investments and we strongly suggest you seek advice before acting upon any recommendation. Kalkine Pty Ltd has made every effort to ensure the reliability of information contained in its newsletters and websites. All information represents our views at the date of publication and may change without notice. To the extent permitted by law, Kalkine Pty Ltd excludes all liability for any loss or damage arising from the use of this website and any information published (including any indirect or consequential loss, any data loss or data corruption). If the law prohibits this exclusion, Kalkine Pty Ltd hereby limits its liability, to the extent permitted by law to the resupply of services. There may be a product disclosure statement or other offer document for the securities and financial products we write about in Kalkine Reports. You should obtain a copy of the product disclosure statement or offer document before making any decision about whether to acquire the security or product. The link to our Terms & Conditions has been provided please go through them and also have a read of the Financial Services Guide. On the date of publishing this report (mentioned on the website), employees and/or associates of Kalkine Pty Ltd do not hold positions in any of the stocks covered on the website. These stocks can change any time and readers of the reports should not consider these stocks as advice or recommendations.
 AU
AU
 Please wait processing your request...