Navigator Global Investments Limited
.png)
NGI Details
Continued Positive Outlook: Navigator Global Investments Limited (ASX: NGI) is an asset management company that provides hedge fund services to retail, wholesale and institutional investors across the globe. Recently, the group’s Assets Under Management (AUM) for Quarter ended 31 March 2018 have been estimated at USD 10.56 bn compared to USD 10.46 bn as at December 2017. Of which, Net flow was down by USD 0.02 bn while performance was up by USD 0.12 bn during the same period. This performance includes investment performance approach, market movements, and the impacts of foreign exchange on non-USD denominated AUM and distributions. We believe that the Group will keep on executing its methodology to hold and develop AUM through several factors such as constantly delivering investment performance in accordance with the investment strategies of the relevant funds and portfolios; expanding global distribution reach; and providing a high level of service to the clients from all parts of the business, with quality and timely reporting on their investments and a proactive approach to ensure meeting all investment needs.
.png)
Asset Under Management (AUM) Performance (Source: Company Reports)
Besides this, the Group has entered into an agreement to acquire assets from Mesirow Advanced Strategies (MAS) which is the multi-manager hedge fund division of Mesirow Financial. A significant portion of the MAS team is expected to join Lighthouse as part of the transition and will continue to provide investment oversight, operational support and client service to the MAS business. This results in a broader and complementary set of resources and talent across the organisation and provides greater flexibility in constructing and executing portfolios. Further, we expect a part of the process to be completed prior to the targeted mid-year closing date. Based on aforesaid facts, the group seems to have a robust pipeline for more customised mandate wins in new distribution markets in the Middle East, Japan and Europe. On the foregoing development and stock movement of 7.28% in last three months (as at April 26, 2018), we remain positive on the company’s outlook and give a “Speculative Buy” recommendation on the stock at the current market price of $ 3.820.
.png)
NGI Daily Chart (Source: Thomson Reuters)
EML Payments Limited
.png)
EML Details
Long Term Player: EML Payments Limited (ASX: EML) is a growing ASX listed FinTech company focused on enhancing their brand partners, by offering innovative accessible prepaid programs. The group has strong presence in the world and currently managing approximately 1,100 card programs in 19 countries. On financial front, the group has recorded growth in gross debit volume growth at a CAGR of 114% during HY2014 to HY2018. Revenue and EBITDA recorded CAGR growth of 74% and 259%, respectively during the same period. Moreover, the group has built a strong culture among the distributors & dealers where the dealers not only promote company’s products but also invest in training the sales team to explain to the customer how they can extract the maximum benefits out of the products. This strategy will support the topline line growth of the company in years to come.
.png)
Key Financials – 5 Year CAGR (Source: Company Reports)
As per the latest update, the company reaffirms its February guidance and expects to maintain an EBTDA range of $19.5 million to $21.5 million for FY18. Gross Debit Volume and Revenue have grown faster than expenses which resulted in EBTDA margin expansion (11% in 1HFY15 to 35% in 1HFY18). The stock price was down by 42.20 per cent in the past six months as on April 26, 2018 owing to volatility and mixed views on growth trajectory given the regulatory changes on purchasing of gift cards. However, the stock has recover about 6.8% in last one month. Based on strong distribution network, strong dealer community, high level of customer satisfaction and robust performance in past 5 years, we maintain a “Buy” on the stock at the current market price of $ 1.240.
.png)
EML Daily Chart (Source: Thomson Reuters)
Afterpay Touch Group Limited
.png)
APT Details
Expansion to Drive Growth: Afterpay Touch Group Limited (ASX: APT) recorded solid business growth in Q3FY18 as compared to Q3FY17. Underlying sales grew by 400% to $14500 Mn in Q3FY18 from $290 Mn in Q3FY17.In addition to this, the company gained approximately 1.8 Mn customers in Q3FY18 from 1.5 Mn at the end of Q2 FY18 and it is still growing at approximately 3,300 new customers per calendar day.The new Afterpay customer recorded growth of approximately 30% in the third quarter of FY18 as compared to Q3 of FY17. Recently, the group successfully closed A$50 million offering of 4-year senior unsecured Notes at a fixed coupon of 7.25% per annum and these were scheduled to settle on 27 April 2018. The transaction received strong support from institutional and professional investors, demonstrating confidence in the Company’s growth strategy. The transaction diversifies APT’s current debt funding sources and provides additional tenor to the Company’s debt maturity profile. Up 3.5% on April 27, 2018, the group is continuing to focus on having increased retailers on-board onto the Afterpay platform and expanding business in US market to support overall growth of the company in future. As of now, we give a “Hold” recommendation on the stock at the current market price of $ 5.950.
.png)
APT Daily Chart (Source: Thomson Reuters)
Stemcell United Limited
.png)
SCU Details
Potential in Dendrobium market:Stemcell United Limited (ASX: SCU) is engaged in sourcing, producing, marketing and selling of Resina Draco Blume and other medicines. It is a biotechnology company, which focuses on the growth, reproduction, culture and extraction of stem cells for medicinal, health and beauty applications using its technology. The group recorded revenue of $168,667 in December 2017 from the sale of dendrobium Officinale related products, marking a growth of 100% on YoY basis. However, net loss after tax recorded $1,889,161 in 1HFY18 from the profit of $174,277 in 1HFY17. The net loss of 31 December 2017 is mainly due to impairment of intangible assets of $1,284,600. However, the cash and cash equivalent at the end of the half year was around $779,465 that will be used to support business operations further.
.png)
1HFY18 Performance (Source: Company Reports)
Dendrobium is a popular product in China and among Chinese societies around the world. The existing Dendrobium market is generating an estimated around 8,000-10,000 tons worth of sales annually in China, with a projected annual growth rate of 10-15%. The company can benefit from the gap between the demand and supply of dendrobium related products in the market. The stock price was down by 40.48% in the past three months, as at April 26, 2018 and trading is at lowest level.The stock got some boost from the recent Co-operation Agreement with Yunnan Hua Fang Industrial Hemp Co. Ltd., under which SCU will pay HFIH RMB2 million (about A$400,000) while Yunnan Hua Fang Industrial Hemp Co. Ltd will utilise its import-export licence in China to enable SCU explore further distribution of SCU’s dendrobium related products in China. However, given the volatility (stock plunging 4% on April 27, 2018) and awaited updates on cannabis-based efforts, we maintain a “Hold” recommendation on the stock at the current market price of $ 0.024.
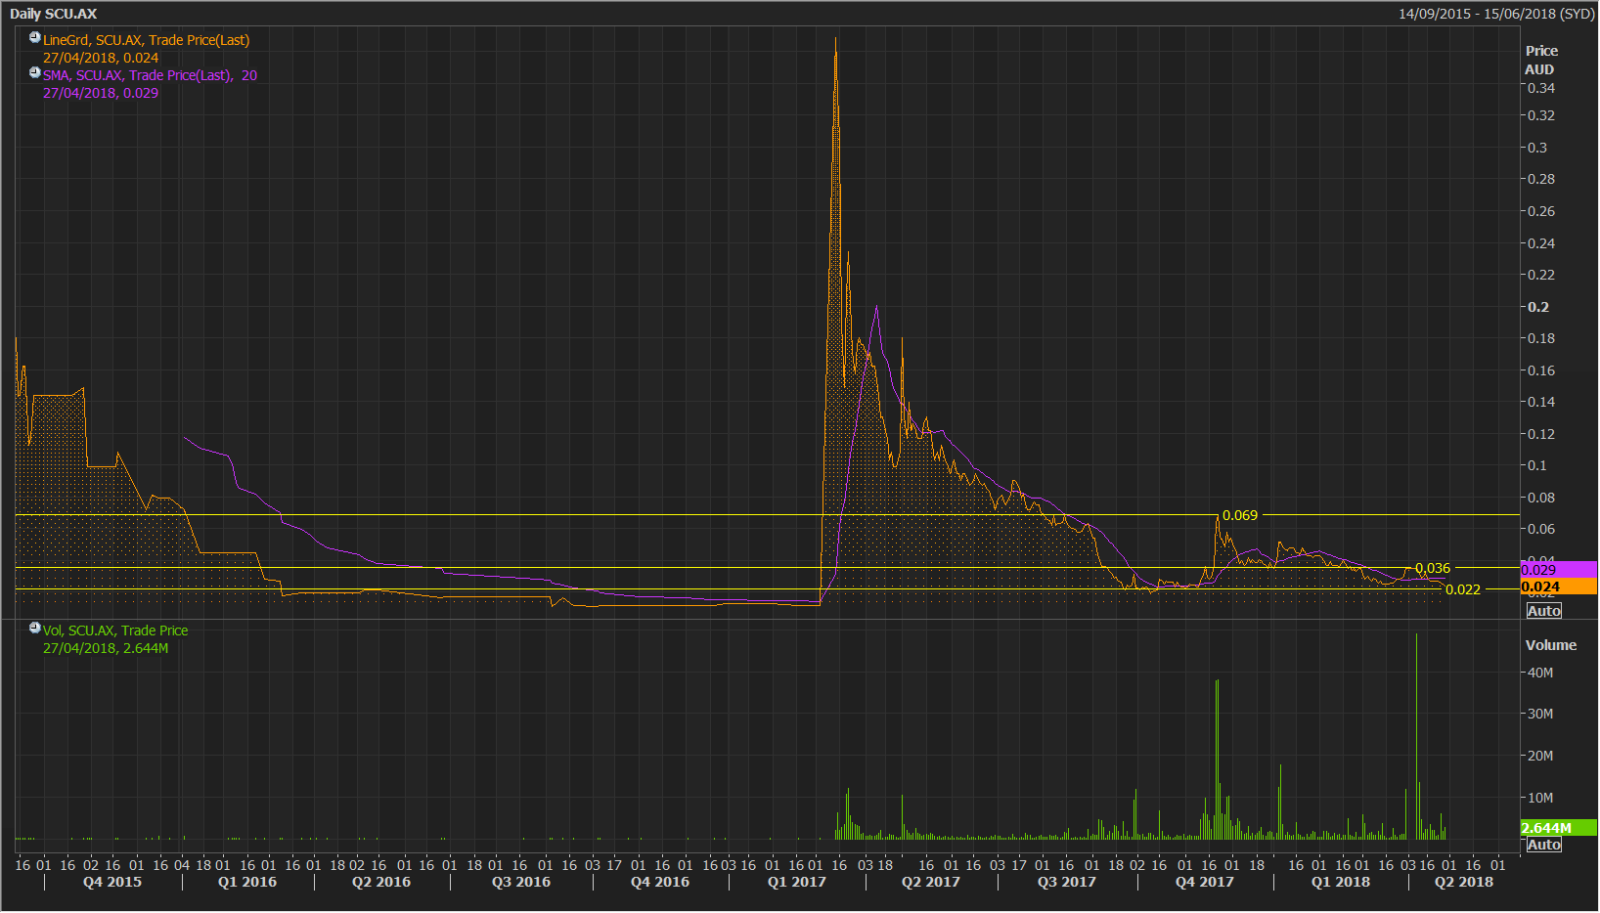
SCU Daily Chart (Source: Thomson Reuters)
Disclaimer
The advice given by Kalkine Pty Ltd and provided on this website is general information only and it does not take into account your investment objectives, financial situation or needs. You should therefore consider whether the advice is appropriate to your investment objectives, financial situation and needs before acting upon it. You should seek advice from a financial adviser, stockbroker or other professional (including taxation and legal advice) as necessary before acting on any advice. Not all investments are appropriate for all people. Kalkine.com.au and associated pages are published by Kalkine Pty Ltd ABN 34 154 808 312 (Australian Financial Services License Number 425376). The information on this website has been prepared from a wide variety of sources, which Kalkine Pty Ltd, to the best of its knowledge and belief, considers accurate. You should make your own enquiries about any investments and we strongly suggest you seek advice before acting upon any recommendation. Kalkine Pty Ltd has made every effort to ensure the reliability of information contained in its newsletters and websites. All information represents our views at the date of publication and may change without notice. To the extent permitted by law, Kalkine Pty Ltd excludes all liability for any loss or damage arising from the use of this website and any information published (including any indirect or consequential loss, any data loss or data corruption). If the law prohibits this exclusion, Kalkine Pty Ltd hereby limits its liability, to the extent permitted by law to the resupply of services. There may be a product disclosure statement or other offer document for the securities and financial products we write about in Kalkine Reports. You should obtain a copy of the product disclosure statement or offer document before making any decision about whether to acquire the security or product. The link to our Terms & Conditions has been provided please go through them and also have a read of the Financial Services Guide. On the date of publishing this report (mentioned on the website), employees and/or associates of Kalkine Pty Ltd do not hold positions in any of the stocks covered on the website. These stocks can change any time and readers of the reports should not consider these stocks as advice or recommendations.
 AU
AU

 Please wait processing your request...