Transurban Group
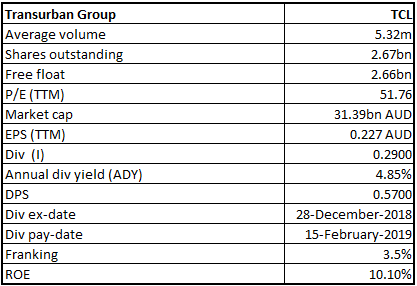
TCL Details
Average Daily Traffic Rose 3.3% in September 2018 quarter: Transurban Group (ASX: TCL) had earlier reported the results for the September 2018 quarter which stated that the company’s average daily traffic or ADT witnessed the rise of 3.3% and the company also encountered favourable momentum in its markets. In the September 2018 quarter, the company also witnessed the financial close with respect to the 51% acquisition of WestConnex. The company has also managed to garner equity amounting to $4.8 billion so that the financing of the acquisition can be done.
Distribution Growth Expected in FY 2019: As demonstrated by the investor presentation published in August 2018, Transurban is expected to witness growth in terms of the distributions. The presentation stated that, in FY 2019 and FY 2020, the company has been targeting mid-single digit growth when it comes to the distribution. However, in FY 2019, the company believes that it would post the distribution of 59.0 cps.

Distribution Growth (Source: Company Reports)
The company also stated that moving forward, it is planning to work towards making the distributions of around 100% of the free cash flow (or FCF).
Stock Recommendation: On the monthly chart of Transurban Group, Exponential Moving Average or EMA has been applied and default values were considered. As per the observation, the stock price has crossed the EMA and is moving upwards, hinting that the stock might encounter bullish momentum.
As a result, we maintain our “Buy” rating on the stock at the current market price of A$11.650 per share.
.png)
TCL Daily Chart (Source: Thomson Reuters)
Downer EDI Limited
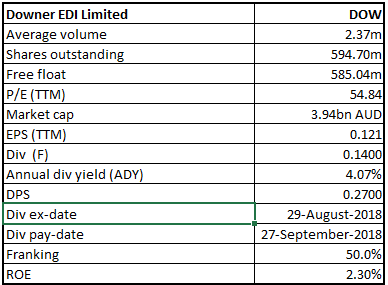
DOW Details
Roads Business Supported Downer’s Transport Revenues: In FY 2018, Downer EDI Limited (ASX: DOW) generated total revenues amounting to $12.6 billion reflecting the rise of 61.5% on the YoY basis. The company’s transport revenues were aided by Australia and New Zealand’s roads business. However, deployments in the Australian transport projects also supported the transport revenues.
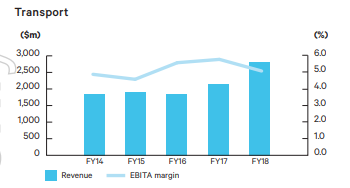
Transport Division (Source: Company Reports)
The underlying EBITA of Transurban Group stood at $479.6 million in FY 2018 reflecting the rise of 68.2% on the YoY basis because of the favourable momentum in the EBITA which was witnessed in the Transport, Rail, Utilities as well as EC&M and Spotless contribution which was of twelve months.
Road Construction, Renewable Project to Support DOW: As showcased in the investor presentation of August 2018, with regards to the Australian market, moving forward (in the short term), the Utility business would be witnessing numerous renewable projects. In the same market, the company would also be supported by the deployments from the State Government towards public transport.
With regards to the New Zealand markets, the company had stated that the road network management as well as the related maintenance would be robust.
Stock Recommendation: On the daily chart of Downer EDI Limited, Moving Average Convergence Divergence or MACD has been applied and default values were used. As per the observation, the MACD line has crossed the signal line and is moving upwards representing the bullish momentum.
As a result, we maintain our “Buy” rating on the stock at the current market price of A$6.760 per share (up 1.961% on December 31, 2018).
.png)
DOW Daily Chart (Source: Thomson Reuters)
Challenger Limited
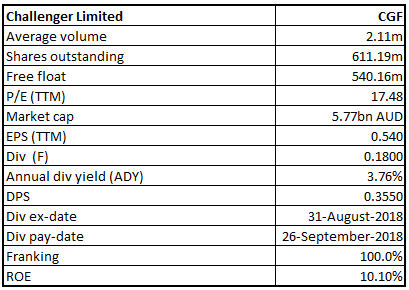
CGF Details
Customer Base Expansion Supported Challenger in 2018: The top management of Challenger Limited (ASX: CGF) stated that the company has been benefited by customer base expansion. This expansion has been achieved by the company with help of the diversification with regards to products as well as distribution activities on the international basis and within Australia. The company’s Funds Management business also witnessed favourable momentum in FY 2018. This business encountered net flows amounting to $5.3 billion in FY 2018. During the same period, the funds management business’ average FUM witnessed the rise of 19% on the YoY basis and stood at $73.4 billion on the back of favourable investment markets as well as robust net flows.
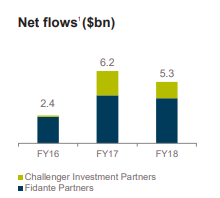
Funds Management Business (Source: Company Reports)
Distribution Capability to Support Challenger Limited: Moving forward, the funds management business of Challenger Limited would be helped by the company’s distribution capability, superannuation system of Australia, expansion on the international basis as well as robust performance of the investment (long-term). The company happens to possess significant position with respect to the retirement incomes. Its differentiated model provides the company with numerous competitive advantages.
As depicted by the October release related to the AGM, the company believes it would achieve the growth in the range of 8-12% in the net profit before tax (normalised) in FY 2019 as compared to FY 2018.
Stock Analysis: On the daily chart of Challenger Limited, Moving Average Convergence Divergence or MACD has been applied and default values have been considered. As per the observation, there are expectations that the MACD line might cross the signal line and after the crossover, there might be bullish momentum.
As a result, we maintain our “Buy” rating on the stock at the current market price of A$9.490 per share.
.png)
CGF Daily Chart (Source: Thomson Reuters)
Qantas Airways Limited
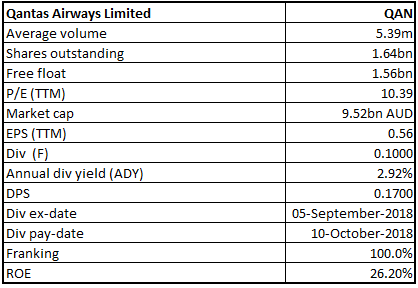
QAN Details
Costs Offset by Revenue Growth: Qantas Airways Limited (ASX: QAN) had earlier reported its first quarter results. In Q1 FY 2019, the company posted total revenues of $4.41 billion as compared to pcp which implies the rise of 6.3%. In Q1 FY 2019, the company’s unit revenues (RASK) witnessed the rise of 5.4% on pcp which supported the company in largely offsetting the elevated levels of fuel costs.
The robust momentum in the company’s revenues in Q1 FY 2019 supported it in partially offsetting the elevated non-fuel expenses like the effect of the weaker Australian dollar as well as increased commissions which have been given out. However, in FY 2018, the company posted a statutory profit before tax amounting to $1.39 billion which implies the rise of 18% on the YoY basis.
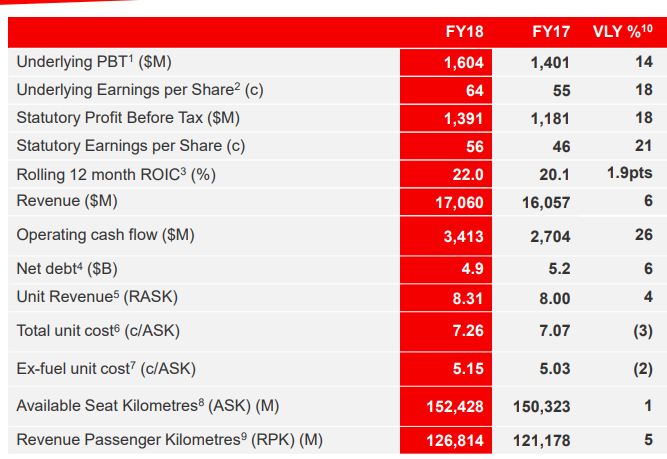
QAN’s FY 2018 Key Metrics (Source: Company Reports)
Capacity Discipline to Support QAN: As depicted by FY 2018 results presentation of Qantas Airways, the company happens to be in the robust position to tackle the increased fuel costs. The company had stated that, in the domestic markets, it would be tackling the higher fuel prices via dual brand strategy as well as with the help of capacity discipline.
It also stated that, in FY 2019, the transformation program would be able to give approximately $400 million with respect to the gross benefits. Also, the company is expected to post robust cash flows.
Stock Analysis: On the daily chart of Qantas Airways, Moving Average Convergence Divergence or MACD has been applied and default values have been used. As per the observation, the MACD line has crossed the signal line and is trending in the upward direction which signifies the bullish momentum.
As a result, we maintain our “Buy” rating on the stock at the current market price of A$5.790 per share.
.png)
QAN Daily Chart (Source: Thomson Reuters)
Commonwealth Bank of Australia
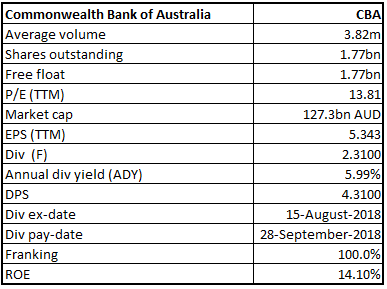
CBA Details
Decent Performance in Q1 FY 2019: Commonwealth Bank of Australia (ASX: CBA) managed to post decent performance in Q1 FY 2019 and the bank’s fundamentals have remained robust. In Q1 FY 2019, the bank witnessed growth in the deposits and its balance sheet happens to be robust. The bank is also possessing decent credit quality.
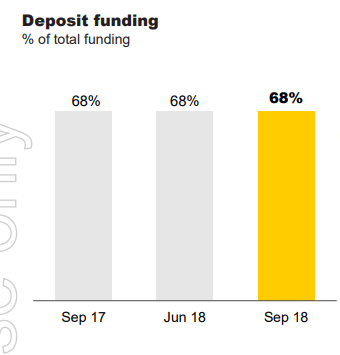
Balance Sheet Strength (Source: Company Reports)
The bank is also maintaining the strong footing when it comes to liquidity as well as funding positions. Talking about the long-term funding in Q1 FY 2019, the bank had issued $8.8 billion. At September 2018, the bank’s LCR (or Liquidity Coverage Ratio) stood at 133% while in June 2018, it was 131%. The bank has maintained its focus towards fulfilling the customers’ needs.
Robust Capabilities to Support CBA Moving Forward: Commonwealth Bank of Australia has maintained its clear focus towards the reduction of the cost base which could enable it to initiate the deployments towards the innovative tools. Moving forward, the bank has plans to work towards the cost reduction, operational risk and compliance, innovation as well as data and analytics.
Additionally, with respect to the business banking, the bank had stated that it would move towards hiring as well as towards the innovation so that it can compete.
Stock Analysis: On the daily chart of Commonwealth Bank of Australia, one technical indicator named Moving Average Convergence Divergence or MACD is applied and default values were used for the purposes. As per the observation, the MACD line has crossed the signal line and is moving in the upward direction. This signifies that the stock might witness bullish momentum.
As a result, we maintain our “Buy” rating on the stock at the current price of A$72.390 per share.
.png)
CBA Daily Chart (Source: Thomson Reuters)
Ramsay Health Care Limited
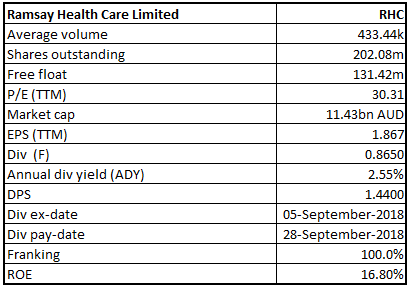
RHC Details
Cost Management Strategies Supported RHC’s Australian Business: Ramsay Health Care Limited (ASX: RHC) had stated that its Australian business, in FY 2018, managed decent performance even though there were certain industry headwinds which reflect strength as well as the portfolio’s diversity. The management of the company had stated that the favourable momentum in the EBIT with respect to the Australian region got supported by the strategies which focused towards the cost management and because the company got inclined towards the operational efficiencies and also because of some one-off benefits.
Australian Business (Source: Company Reports)
Focus Towards Innovation to Support RHC’s Australian Business: Ramsay Health Care Limited had stated that, with respect to the Australian business, the company would be inclined towards the cost optimisation strategies as well as innovation. With respect to the same business, the company had stated that the healthcare demand would be supported by the industry fundamentals (long-term).
The company had stated that the deployments which have been made with the focus towards strengthening the business as well as the initiatives related to the growth would support the earnings moving forward.
Stock Analysis: Exponential Moving Average or EMA has been applied on the daily chart of Ramsay Health Care Limited and default values have been used. As per the observation, the stock price has crossed the EMA and is moving upwards. Therefore, there are expectations that the stock might encounter bullish momentum.
As a result, we maintain our “Buy” rating on the stock at the current market price of A$57.730 per share.
.png)
RHC Daily Chart (Source: Thomson Reuters)
Disclaimer
The advice given by Kalkine Pty Ltd and provided on this website is general information only and it does not take into account your investment objectives, financial situation or needs. You should therefore consider whether the advice is appropriate to your investment objectives, financial situation and needs before acting upon it. You should seek advice from a financial adviser, stockbroker or other professional (including taxation and legal advice) as necessary before acting on any advice. Not all investments are appropriate for all people. Kalkine.com.au and associated pages are published by Kalkine Pty Ltd ABN 34 154 808 312 (Australian Financial Services License Number 425376). The information on this website has been prepared from a wide variety of sources, which Kalkine Pty Ltd, to the best of its knowledge and belief, considers accurate. You should make your own enquiries about any investments and we strongly suggest you seek advice before acting upon any recommendation. Kalkine Pty Ltd has made every effort to ensure the reliability of information contained in its newsletters and websites. All information represents our views at the date of publication and may change without notice. To the extent permitted by law, Kalkine Pty Ltd excludes all liability for any loss or damage arising from the use of this website and any information published (including any indirect or consequential loss, any data loss or data corruption). If the law prohibits this exclusion, Kalkine Pty Ltd hereby limits its liability, to the extent permitted by law to the resupply of services. There may be a product disclosure statement or other offer document for the securities and financial products we write about in Kalkine Reports. You should obtain a copy of the product disclosure statement or offer document before making any decision about whether to acquire the security or product. The link to our Terms & Conditions has been provided please go through them and also have a read of the Financial Services Guide. On the date of publishing this report (mentioned on the website), employees and/or associates of Kalkine Pty Ltd do not hold positions in any of the stocks covered on the website. These stocks can change any time and readers of the reports should not consider these stocks as advice or recommendations.
 AU
AU

 Please wait processing your request...