.png)
Stocks’ Details
National Australia Bank Limited
Strong asset quality across segments: National Australia Bank Limited. (ASX: NAB) is an international banking group which operates in Australia, New Zealand, Europe, Asia, and the United States. Recently, the company has faced allegations regarding charging the customers for the services that were never delivered to them. On this, the CEO Mr. Andrew Thorburn has refuted the allegations and said that the company doesn’t have any dishonest intentions although admitting at the same time that the bank has already taken too long to compensate the customers. With this speculative news, the share price climbed up 1.138% on 27 November 2018. On the other hand, the company has witnessed a decent growth in the Net Interest Incomes (NII) by 2.5% in FY18 on Y-o-Y basis. This growth was volume driven particularly in the segments of housing and business lending. Moreover, the lower deposit costs and a fall in the long-term wholesale funding cost aided the cause. This growth was partially offset by the lower housing lending margins coupled with the rising short-term wholesale funding costs. Moreover, the group’s cash earnings came in at $ 5.70 Bn in FY18 & saw a decline of 14.2% on account of the restructuring related costs and the customer remediation expenses incurred for the period. Apart from this, increased investment in technology & full year impact of bank levy aided in the reduction of cash earnings. In continuation with this the cash ROE for the year came in at 11.70%, this was due to the lower cash earnings and growing investments in the customer & technology capabilities. On the balance sheet front, total assets of the firm grew by 2.3%, this was driven by the growth achieved in the loans and advances on account of the group’s continued focus on the housing lending profile. Further, the company seems to be adequately capitalized as pe APRA regulation on Basel III norms with a CET 1 ratio of 10.20% and a tier 1 ratio of 12.38% as at the end of the financial year.
Going further the company will be banking largely on macro factors for the growth aspect in the coming fiscal.Also, it is expected that the trading environment in Australia will remain challenging which is one of the largest markets for the bank.
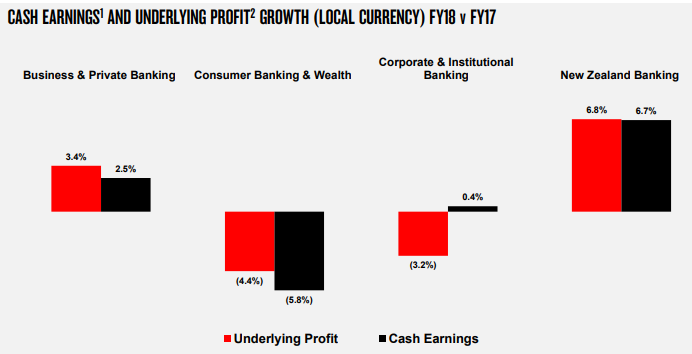
Cash Earnings and Underlying Profit growth (Source: Company Reports)
Meanwhile, the stock price has fallen substantially by 11.09% over the past three months as on 26 November 2018 and traded at the lower level, representing an attractive opportunity for the investors to acquire the stock at these levels. Hence, considering the firm’s outperformance in terms of return on equity, we maintain our “Buy” recommendation on the stock at the current market price of $24.890.
Magellan Financial Group Limited
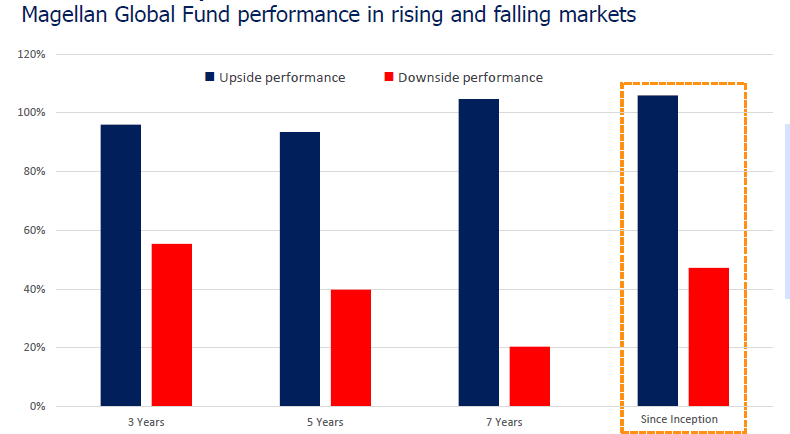
Constant Growth in FUM to drive revenues: Magellan Financial Group Ltd (ASX: MFG) is a specialist fund management group involved in the development of globally-focused investment funds for retail and institutional investors. As at 31 October 2018, the company has funds under management amounting to $72,981 Mn, of which $19,725 Mn is from retail investors and the rest from the institutional investor. The application of funds represents that the company has more than 72% exposure towards global equities. Besides this, the company posted strong numbers for the year ended June 30, 2018 exhibited by a 29% growth in the average funds under management which stood at $59 Bn for the 12 months to June 30, 2018. This growth in FUM was driven by the robust investment performance of $ 8.5 Bn, net inflows post distributions of $4.4 Bn and $6.3 Bn from the acquisition of Airlie. The revenues for the FY 2018 came in at $452.6 Mn scaling a rise of 34% on Y-o-Y basis. It was mainly driven by the management fees revenues underpinning the growth in FUM and performance fees. Resultantly, PAT has shown a rise of 8% and stood at $211.8 Mn. This was due to a stellar investment portfolio performance in global equities & infrastructure projects segments. The cost to income ratio was recorded at 25% in comparison with 26.8% for the PCP, on account of the efficient conduct of operations. Going further, there is a view across markets that the company has achieved a maturity stage in its global equities business and in the coming years it would not be able to see substantial growth in its FUM’s. However, in view of the management, the most important factors which would fuel further growth shall still remain intact in the form of- strong client base, the target to achieve a revenue growth of 7-9 % on an average over the medium to long-term on existing FUM’s and the dividend yield that is delivered to the shareholders after meeting the capital needs which has led to an increase in pay-out ratio by 20%.
Number of Active ETF Unitholders Quarterly Trends (Source: Company Reports)
Meanwhile, the share price has fallen a modest 7.64% in the past three months as at November 26, 2018 and traded at reasonable PE multiple of 21.10x. Considering a constant growth in FUM and a robust Investment portfolio performance, we maintain our “Buy” recommendation on the stock at the current market price of $26.170 (up 1.671% on 27 November 2018).
CYBG Plc
Declining NIMs due to the immense competition: CYBG Plc (ASX: CYB) provides commercial banking services for retail and institutional customers. CYBG Plc operates in the United Kingdom. Recently, the group informed the market that the board has recommended a final ordinary dividend of 0.031 GBP per share for the financial year ended 30 September 2018. This would be finalized on the shareholder’s approval in the ensuing AGM. The record date for the same is set on January 18, 2019 and the payment date shall be February 15, 2019. For the year ended 30 September 2018, the company has witnessed a growth in the Net Interest Incomes (NIIs) by 1% to £ 851 Mn on Y-o-Y basis. This growth was driven by strong volumes witnessed in business lending. However, the NIMs have declined 10 Bps and came in at 2.17% which was in line with the guidance. This was on account of the decline in the mortgage interest rates due to the competitive environment and a change in product mix with a greater share towards low yielding owner-occupier lending. The non-interest income plummeted by 9% on PCP and came in at £156 Mn. This was on account of the reduction in the Net fee and commission due to the major costs incurred toward the “personal current account campaign” which resulted in the increase in current account volumes. Moreover, the firm’s return on tangible equity (ROTE) came in at 10.6% vis-s-vis 7.5% over the prior year. This was driven by strong underlying profitability of £331 Mn, up by 13% on Y-o-Y basis.
Further, the company seems to be adequately capitalized as per APRA regulation on Basel III norms with a Total Capital ratio of 15.9% and CET 1 ratio of 10.5 % as at the end of the financial year. The adequacy ratios of the firm are expected to get even better with the adoption of the IRB model which would lead to a significant group’s credit Risk-weighted assets, thus materializing into a 350 Bps increment in the group’s CET 1 ratio. The company’s asset quality remains robust with the SME portfolio performing quite well. This resilience and stability are on account of the diversity maintained in the portfolio as well as the controlled risk appetite coupled with an economic environment supportive of business. This has led to a reduced impaired asset portfolio of £ 83 Mn, the lowest level now for more than ten years. Going further, the near-term outlook in its major lending markets, i.e., UK homeowners and SME remains to be a bit subdued on account of the BREXIT concerns, declining household savings which has led to the slowdown in the deposits. The company also expects to witness tighter competition in the mortgage pricing markets which would lead to margin pressures. And hence the NIMs for 2019 is expected to be in the range of 1.6-1.7%.
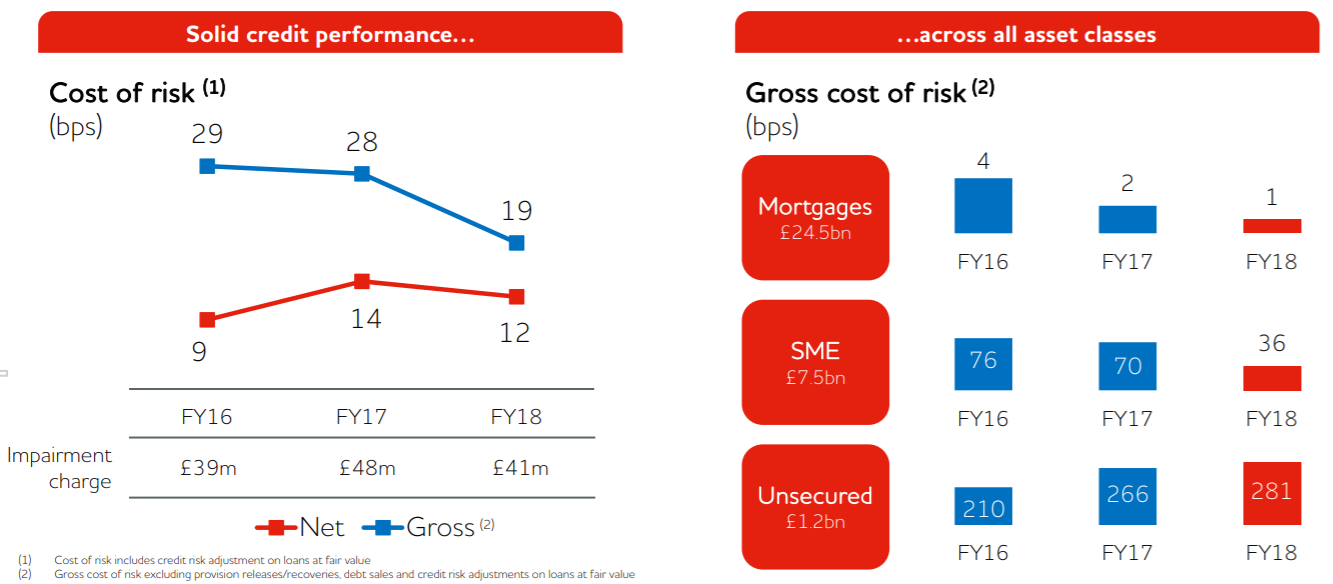
Stable Asset Quality, Brexit Key Uncertainty (Source: Company Reports)
Meanwhile, the stock price has fallen substantially by 27.56% over the past one month as on 26 November 2018. Hence, considering the firm’s subdued performance in terms of declining NIMs and the macroeconomic concerns, we have a wait and watch view on the stock at the price of $3.640, which is trading closer to the 52-week low price.
.PNG)
Stock Price Comparative Chart (Source: Thomson Reuters)
Disclaimer
The advice given by Kalkine Pty Ltd and provided on this website is general information only and it does not take into account your investment objectives, financial situation or needs. You should therefore consider whether the advice is appropriate to your investment objectives, financial situation and needs before acting upon it. You should seek advice from a financial adviser, stockbroker or other professional (including taxation and legal advice) as necessary before acting on any advice. Not all investments are appropriate for all people. Kalkine.com.au and associated pages are published by Kalkine Pty Ltd ABN 34 154 808 312 (Australian Financial Services License Number 425376). The information on this website has been prepared from a wide variety of sources, which Kalkine Pty Ltd, to the best of its knowledge and belief, considers accurate. You should make your own enquiries about any investments and we strongly suggest you seek advice before acting upon any recommendation. Kalkine Pty Ltd has made every effort to ensure the reliability of information contained in its newsletters and websites. All information represents our views at the date of publication and may change without notice. To the extent permitted by law, Kalkine Pty Ltd excludes all liability for any loss or damage arising from the use of this website and any information published (including any indirect or consequential loss, any data loss or data corruption). If the law prohibits this exclusion, Kalkine Pty Ltd hereby limits its liability, to the extent permitted by law to the resupply of services. There may be a product disclosure statement or other offer document for the securities and financial products we write about in Kalkine Reports. You should obtain a copy of the product disclosure statement or offer document before making any decision about whether to acquire the security or product. The link to our Terms & Conditions has been provided please go through them and also have a read of the Financial Services Guide. On the date of publishing this report (mentioned on the website), employees and/or associates of Kalkine Pty Ltd do not hold positions in any of the stocks covered on the website. These stocks can change any time and readers of the reports should not consider these stocks as advice or recommendations.
 AU
AU
 Please wait processing your request...