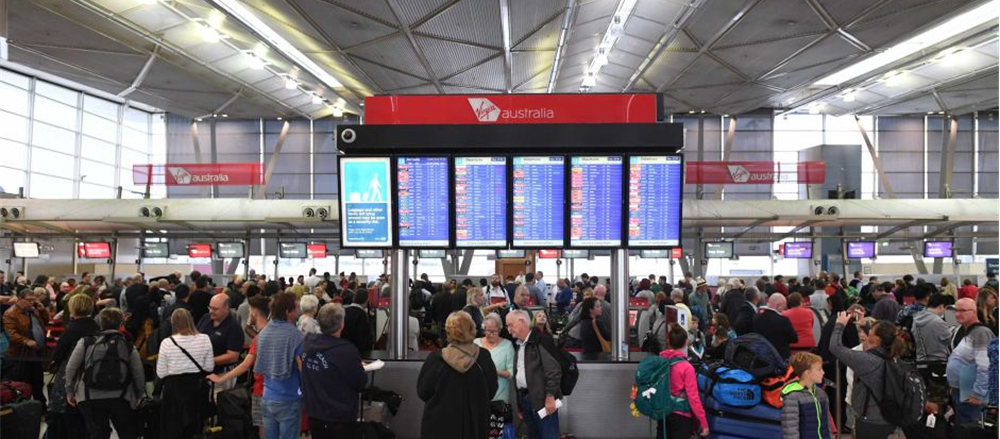
Sydney Airport
Sydney Airport (ASX: SYD) with a market cap of $14.93bn as on November 15, 2018 has received final approval for Sydney Gateway on September 12, 2018. Under this collaboration of Sydney Airport with the NSW government for a period of three years, varied developmental activities will be explored and implemented. The collaboration will help with the improved access to the airport boundaries, wider transportation network and further ground transport projects to deliver enhanced capacity.
Financial metrics: Total Revenue grew by 7.9% to $770.8m in 1H18 as compared to $714.2m in 1H17. 8% growth in EBITDA up to $623.4m in 1H18 from $577m in 1H17, 4% rise in profit before income tax expense up to $194.8m from $187.3m and 4.19% in Profit after tax (PAT) up to $174m from $167m were recorded in 1H18 as compared to the corresponding period 1H17.Meanwhile, 1.7% growth was recorded under traffic from international passengers and 0.4% growth under total traffic of passengers during the month of September as compared to the prior corresponding period. Total passengers grew by 2.9% with international by 4.8% and domestic by 1.8% for YTD-18 as compared to YTD-17. International passenger growth, along with new open skies Agreement between India and Australia in June 2018 will open new business opportunities, and Sydney Gateway that will help in reducing the congestions around the airport will together help SYD to focus on core business and overall strengthening.
However, international traffic is softening slightly and there is falling capacity growth while domestic growth now looks moderate, when we view the month on month trends. September growth was +1.7% against +5% growth of the past couple of months in terms of international traffic.
Technically, the scrip showed downside move from the month of September and continued the downside move in the month of October also. In the current month, on 6-month chart with weekly candle interval, the scrip has formed “tweezer bottom” indicating some support formation and reversal of trend. Major indicators like Relative strength index and Moving average convergence and divergence consolidating in negative territory indicate for some potential in future.
Fundamentally, themarket cap of SYD was recorded at $14.93bn, with P/E of 41.79x and beta below 1x as on November 15, 2018.Meanwhile, the changing traffic trends indicate that cashflow for dividend might drop in CY19 and CY20. SYD with its decent financials and collaboration with NSW for Sydney Gateway exhibits a wait and watch scenario at the current levels of $6.60.
Reliance Worldwide Corporation Limited
Reliance Worldwide Corporation Limited (ASX:RWC) with a market cap of $3.86bn, is established as the largest low cost manufacturer of brass and plastic PTC. In line with its strategy to strengthen its global presence by the acquisition of the businesses under its basket, the group is providing high quality engineered products to its existing range. To expand distribution capabilities, it has acquired John Guest group in June 2018.
Benefits from the acquisition of John Guest: This acquisition has helped the company in exploring and making its geographical presence particularly in the UK and continental Europe as well as to have product and channel exposure and to tap organic growth opportunities across the geographies. The acquisition helped RWC to establish itself as the global leader in the manufacturing and distribution of brass and plastic PTC technology and related products.
Financial Metrics: Net sales grew by 28% to $769.4m in FY18 as compared to $601.7m in FY17, driven by the continuous expansion of SharkBite PTC business in the Americas and the introduction of new PTC products, strong sales performance in the Asia Pacific and EMEA segments. EBITDA before contribution from John Guest and transaction costs expensed reported 25% growth to $150.9m in FY18 from $120.7m in FY17. Cash flow from operations for FY2018 was $80.1 million as compared to $71.9m in FY17.
Technically, the scrip continued with its downtrend from the month of August to the month of October. The scrip is now trading well above the lower bollinger band and major support zone. Major indicators are in positive territory and the scrip looks good.
Fundamentally,themarket cap of RWC was recorded at $3.86bn, with P/E of 39.76x and beta below 1x. RWC has maintained the FY19 EBITDA range of $280-290 m with top-line growth of low double digits expected in the US, high single digits at John Guest and continued growth in Asia-Pacific. RWC with its healthy financials along with acquisitions of strong businesses to expand its distribution capabilities exhibits a “Buy” scenario at the current levels of $4.8 with recent sell-off portraying a good opportunity.
Disclaimer
The advice given by Kalkine Pty Ltd and provided on this website is general information only and it does not take into account your investment objectives, financial situation or needs. You should therefore consider whether the advice is appropriate to your investment objectives, financial situation and needs before acting upon it. You should seek advice from a financial adviser, stockbroker or other professional (including taxation and legal advice) as necessary before acting on any advice. Not all investments are appropriate for all people. Kalkine.com.au and associated pages are published by Kalkine Pty Ltd ABN 34 154 808 312 (Australian Financial Services License Number 425376). The information on this website has been prepared from a wide variety of sources, which Kalkine Pty Ltd, to the best of its knowledge and belief, considers accurate. You should make your own enquiries about any investments and we strongly suggest you seek advice before acting upon any recommendation. Kalkine Pty Ltd has made every effort to ensure the reliability of information contained in its newsletters and websites. All information represents our views at the date of publication and may change without notice. To the extent permitted by law, Kalkine Pty Ltd excludes all liability for any loss or damage arising from the use of this website and any information published (including any indirect or consequential loss, any data loss or data corruption). If the law prohibits this exclusion, Kalkine Pty Ltd hereby limits its liability, to the extent permitted by law to the resupply of services. There may be a product disclosure statement or other offer document for the securities and financial products we write about in Kalkine Reports. You should obtain a copy of the product disclosure statement or offer document before making any decision about whether to acquire the security or product. The link to our Terms & Conditions has been provided please go through them and also have a read of the Financial Services Guide. On the date of publishing this report (mentioned on the website), employees and/or associates of Kalkine Pty Ltd do not hold positions in any of the stocks covered on the website. These stocks can change any time and readers of the reports should not consider these stocks as advice or recommendations.
 AU
AU
 Please wait processing your request...