Company Overview: Tiffany & Co. is a holding company that operates through its subsidiary companies. The Company's principal subsidiary, Tiffany and Company (Tiffany), is a jeweler and specialty retailer. The Company's segments include Americas, Asia-Pacific, Japan, Europe and Other. Through its subsidiaries, the Company designs and manufactures products and operates TIFFANY & CO. retail stores around the world, and also sells its products through Internet, catalog, business-to-business and wholesale operations. The Company also sells timepieces, leather goods, sterling silverware, china, crystal, stationery, fragrances and accessories. The Americas segment includes sale in Company-operated TIFFANY & CO. stores in the United States, Canada and Latin America. As of January 31, 2017, the Asia-Pacific segment included 85 Company-operated TIFFANY & CO. stores. As of January 31, 2017, the Japan segment included 55 Company-operated TIFFANY & CO. stores. The Other segment consists of non-reportable segments.
.jpg)
TIF Details
Prominent Market Presence with Decent Margins: Tiffany & Co. (NASDAQ: TIF) is engaged in designing, manufacturing and marketing jewelry, watches and luxury accessories and it operates through the retail stores of its single most important brand, TIFFANY & CO. As per the revenue recognition, the Company’s net sales can be categorized into four segments viz jewelry collections, engagement jewelry, designer jewelry and all other. The Company generates revenue through retail units, internet or ecommerce, wholesale and business to business and catalogue channels. The jewelry industry is competitively fragmented in nature, while TIF enjoys a strong position and large customer base, which thrives significant competition in all the product categories and geographies. As per the Company’s disclosure, comparable sales constitute the Company-operated stores which are functional for more than twelve months.
In FY18 (for the period ended on December 2018), total revenue stood at $4,442.1 million, posting a rise of 6.53% as compared to $4,169.8 million during FY17. Net profit for the company was recorded at $586.4 million, up 58.44% on y-o-y. Revenue from Jewelry collections stood at $2,374.1 million as compared to $2,146.6 million, while engagement jewelry, designer jewelry and others stood at $1,157.4 million, $544.5 million, and $366.1 million, respectively, during FY18. Looking at the past performance, TIF delivered a CAGR growth of ~1.11% in revenue over the period of FY14 to FY18, while net profit posted a CAGR growth of 4.9% during the same period. The Company has built a product development strategy which consists of the introduction of new design collections, primarily in jewelry, and non-jewelry products, and expand certain existing collections periodically to enhance its product presence among existing and new customers.
Going forward, the Company will enhance its focus on marketing communications, product development and optimization of its store base and digital capabilities to fulfill its objective to be an industry leader in key markets. The Management intends to continue its expansion and optimize its global store base by evaluating potential markets for new TIFFANY & CO. stores, as well as through the renovation, relocation, or closing of existing stores.
.png)
Financial Highlights During 2014-2018 (Source: Company Reports)
Buy-back Program: The Board of directors approved buy-back of shares upto $1.0 billion during May 2018 with expiry in January 2022. During Q2FY19, TIF repurchased $60.0 million worth of Common Stock which constituted approximately 639,000 shares at an average cost of $94 per share while it purchased approximately 910,000 shares of its Common Stock at a total cost of $85.4 million with an average cost of ~$94 per share during the first half of FY19.
Operating Highlights of Q2FY19 for the period ending 30 June 2019: Tiffany & Co. reported its Q2FY19 quarterly results wherein it reported worldwide net sales at $1.0 billion, a decline of 3% on pcp and net earnings of $136 million, down 6% from the prior corresponding period. TIF witnessed a 4% dip in comparable sales on a constant-exchange-rate basis, while net sales during the period decreased 1% from Q2FY18. Comparable sales witnessed a decline of 3% on pcp. During the quarter, TIF posted earnings per diluted share of $1.12 as compared to $1.17 in Q2FY18. Gross margin during the period stood at 62.7% as compared to 64% during Q2FY18, primarily due to a change in sales mix towards the higher price point jewelry. Selling, General and Administrative expenses came in at $473.4 million, down 5% from Q2FY18 on account of lower marketing overheads, which was partly offset by higher occupancy and depreciation expenses. During Q2FY19, Selling, General and Administrative expenses as a percentage of revenue stood at 45.2% as compared to 46.3% in Q2FY18.
.png)
Q2FY19 and H1FY19 Gross Margin (Source: Company Reports)
.png)
Q2FY19 and H1FY19 SG&A (Source: Company Reports)
During Q2FY19, Jewelry collections and Engagement jewelry reported revenue of $570.2 million and $276.6 million as compared to $572.2 million and $284.7 million, respectively, in the prior corresponding period. The designer Jewelry segment reported a revenue of $114.9 million while all other segment derived revenue of $86.8 million during Q2FY19.
.png)
Segments as per product categories (Source: Company Reports)
Six months Operating Highlights: The Company posted Worldwide net sales at $2.1 billion, declined 3% y-o-y, followed by a 4% decline in comparable sales due to a constant-exchange-rate basis. Net sales decreased by 1 % on pcp while comparable sales declined 2% from H1FY18. Gross margin during the period stood at 62.2% as compared to 63.5% during H1FY18. During the first half, gross margin was affected by an increase in wholesale sales of diamonds, which was partly offset by lower product-related costs. Net earnings came in at $261 million as compared to $287 million on prior corresponding year. During the first half, TIF reported net earnings per diluted share at $2.15 as compared to $2.31 in prior corresponding period. TIF opened three stores during the first half and closed two units. At the July end 2019, the Company operated 322 stores, including 124 in the Americas, 90 in Asia-Pacific, 56 in Japan, 47 in Europe, and 5 in the UAE.
.png)
Financial Highlight in Q2FY19 and H1FY19 (Source: Company Reports)
Reportable Segment-wise Performance:
Americas: The segment reported Q2FY19 revenue at $455 million, down 4% on y-o-y basis while revenue during the first half of the financial year 2019 came in at $861 million, a decline of 4% from the first half of FY2018. Lower sales from the segment can be attributed to lower spending by foreign tourists and local customers. The business witnessed a decline in total sales on a constant currency term along with a decline in comparable sales by 4% during the second quarter and first half of FY19. This segment was accounted for 43.42% of the total revenue during Q2FY19, while 41.96% during H1FY19.
Asia Pacific: During Q2FY19, this segment reported net sales at $298 million, down 1% from the previous corresponding period while the business witnessed a dip 3% y-o-y in H1FY19 revenue at $622 million. As far as the comparable sales are concerned, the business reported lower revenue of 3% and 4% during Q2FY19 and H1FY19, respectively, primarily due to the opening of new stores and increased wholesale sales during both the periods. On constant currency terms, total sales were higher by 3% in both the period, while comparable sales were up by 1 % and unchanged during the second quarter and first half, respectively. Both the periods, second quarter and first half of the FY19 were characterized by strong growth across mainland China, while Hong Kong witnessed a soft performance. The Management stated that higher revenue was primarily driven by higher spending by local customers while the business witnessed lower revenues, led by less local tourists. This segment constituted 28.44% of the Group’s revenue during Q2FY19 and 30.31% during H1FY19.
Japan: This segment reported net sales of $155 million in Q2FY19 and $300 million in the first half of FY19, witnessing no change and 2% de-growth, respectively. The comparable sales came lower by 1% and 2% in the second quarter and first half, respectively. Japan accounted for 14.79% of the total revenue in Q2FY19 and 14.62% in H1FY19.
Europe: Total net sales from this segment came in at $116 million and $219 million during the second quarter and the first half, reporting a fall of 4% during each period. Comparable sales reported a dip of 6% and 7%, respectively, primarily due to the effect of foreign currency translation. On a constant-exchange-rate basis, total sales were unchanged in the second quarter while increased 2% on pcp, during the first half of FY19. The comparable sales in Europe showed a fall of 2% and 1% in Q2FY19 and H1FY19, respectively, due to broad-based regional softness. This segment constituted 11.07% of the total revenue during Q2FY19 and 10.67% in H1FY19.
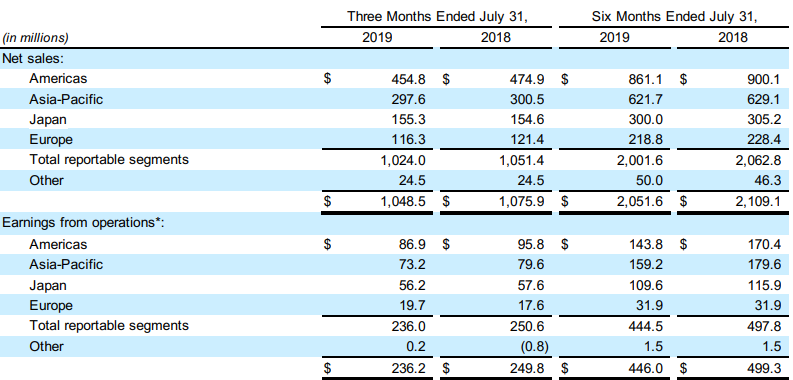
Geographical bifurcation of revenue and earnings (Source: Company Reports)
Top 10 Shareholders: The top 10 shareholders have been highlighted in the table, which together form around 44.02% of the total shareholding. The Vanguard Group, Inc. and Lone Pine Capital, LLC. hold the maximum interests in the company at 10.77% and 5.44%, respectively.
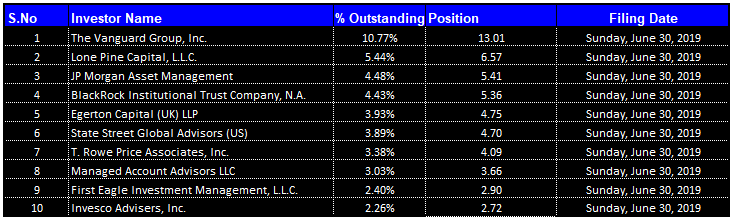
Top 10 Shareholders (Source: Thomson Reuters)
Key Metrics: The Company posted decent margins in the second quarter of FY2019. Gross margin for Q2FY19 stood at 62.7%, higher than Q1FY19 and industry median. EBITDA and net margin for Q2FY19 came in at 23.7% and 13%, higher than the industry median of 9.7% and 4.4%, respectively. Return on Equity (ROE) stood at 4.3% in Q2FY19, higher than the industry median of 3.7%.
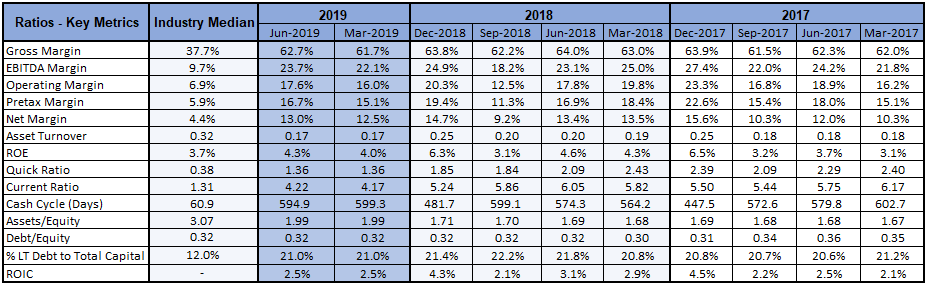
Key Metrics (Source: Thomson Reuters)
Fiscal 2019 Outlook: Net sales for FY19 are likely to grow at a low-single-digit from FY18, while net earnings per diluted share are expected to rise by a low-to-mid-single-digit percentage from the previous financial year. The Company is expecting worldwide comparable sales to remain at the same levels as of FY18 while the Management is expecting growth in worldwide gross retail square footage by 3% on y-o-y basis. The Company maintains operating margin guidance as the previous financial year while expects lower interest and other expenses. The Management expects the income tax rate to be in low- 20’s% and a positive effect on profitability from share repurchases program. Net cash from operating activities is expected at $750 million, while free cash flow is expected at $400 million. Capital expenditures are expected at $350 million.
Valuation Methodologies
Method 1: Price to Cash Flow Multiple Approach:
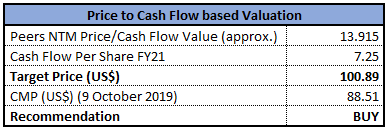
P/CF Multiple Valuation (Source: Thomson Reuters)
Method 2: Price to Book Value Multiple Approach:
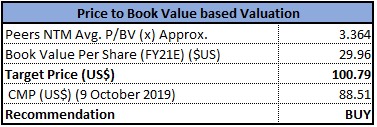
P/BV Multiple Valuation (Source: Thomson Reuters)
Note: All forecasted figures and peers have been taken from Thomson Reuters, *NTM-Next Twelve Months
Stock Recommendation: At the current market price of $88.51, the stock is trading at a price to earnings multiple of 19.28x with a market capitalization of ~$10.69 billion. The Company is focused on improving its business operations through new systems, more effective processes and cost restraint, to drive margin growth. The Company has developed a substantial product supply infrastructure for the procurement and processing of diamonds and the manufacturing of jewelry. The company posted a strong gross margin for Q2FY19 at 62.7%, higher than Q1FY19 and industry median of 61.7% and 37.7%, respectively. EBITDA and net margin for Q2FY19 came in at 23.7% and 13%, higher than the industry median of 9.7% and 4.4%, respectively. Considering the aforesaid facts, we have valued the stock, using two relative valuation methods, i.e., Price to Cash Flow and Price to Book value multiples, and arrived at a target price of lower double-digit growth (in % term). Hence, we recommend a “Buy” rating on the stock at the current market price of $88.51, up 2.17% on 9 October 2019.
.png)
TIF Daily Technical Chart (Source: Company Reports)
Disclaimer
The advice given by Kalkine Pty Ltd and provided on this website is general information only and it does not take into account your investment objectives, financial situation or needs. You should therefore consider whether the advice is appropriate to your investment objectives, financial situation and needs before acting upon it. You should seek advice from a financial adviser, stockbroker or other professional (including taxation and legal advice) as necessary before acting on any advice. Not all investments are appropriate for all people. Kalkine.com.au and associated pages are published by Kalkine Pty Ltd ABN 34 154 808 312 (Australian Financial Services License Number 425376). The information on this website has been prepared from a wide variety of sources, which Kalkine Pty Ltd, to the best of its knowledge and belief, considers accurate. You should make your own enquiries about any investments and we strongly suggest you seek advice before acting upon any recommendation. Kalkine Pty Ltd has made every effort to ensure the reliability of information contained in its newsletters and websites. All information represents our views at the date of publication and may change without notice. To the extent permitted by law, Kalkine Pty Ltd excludes all liability for any loss or damage arising from the use of this website and any information published (including any indirect or consequential loss, any data loss or data corruption). If the law prohibits this exclusion, Kalkine Pty Ltd hereby limits its liability, to the extent permitted by law to the resupply of services. There may be a product disclosure statement or other offer document for the securities and financial products we write about in Kalkine Reports. You should obtain a copy of the product disclosure statement or offer document before making any decision about whether to acquire the security or product. The link to our Terms & Conditions has been provided please go through them and also have a read of the Financial Services Guide. On the date of publishing this report (mentioned on the website), employees and/or associates of Kalkine Pty Ltd do not hold positions in any of the stocks covered on the website. These stocks can change any time and readers of the reports should not consider these stocks as personalised advice.