Company Overview: Synnex Corporation is a business process services company. The Company provides a range of distribution, logistics and integration services for the technology industry and providing outsourced services focused on customer engagement strategy. The Company operates in two segments: Technology Solutions and Concentrix. The Company's Technology Solutions segment distributes peripherals, information technology (IT) systems, including data center server and storage solutions, system components, software, networking/communications/security equipment, and consumer electronics (CE) and complementary products. Within its Technology Solutions segment, the Company also provides systems design and integration solutions. The Company's Concentrix segment offers a portfolio of solutions and end-to-end business services focused on customer engagement strategy, process optimization, technology innovation, front and back-office automation and business transformation.
(2).png)
SNX Details
Concentrix Segment Growth Led by the Acquisition of Convergys: SYNNEX Corporation (NYSE: SNX), a Fortune 200 corporation (as per the annual report 2018) and a leading business process services company, offers a wide range of distribution, logistics and integration services to Information Technology sector. The company also offers outsourced services to multiple sectors. The company operates in a number of countries in North & South America, Asia & Europe through two main segments - Technology Solutions, and Concentrix.
Technology Solutions segment dominates the overall sales and accounted for ~88% of the total revenue in FY18. Looking at the product category within the Technology Solution segment, the contribution from the products over FY16-FY18 are-
.png)
Product Mix for Technology Solutions segment (Source: Company Reports)
As per the Annual Report of FY18, the main OEM suppliers are Alphabet Inc. (Google), Asus Tek Computer Inc., Cisco Systems, Inc., HP Inc. (the largest OEM supplier, representing ~12% of the total revenue), Hewlett Packard Enterprise, Intel Corporation, Lenovo, Microsoft, Panasonic, and Samsung Semiconductor Inc.
The other segment, Concentrix, provides a portfolio of technology-enabled strategic solutions and end-to-end business services with serving 650 clients in various industry verticals which includes automotive, banking & financial services, consumer electronics, energy & public sector, healthcare, insurance, media & communications, retail & e-commerce, technology, and travel, transportation & tourism. Concentrix segment accounted for ~12% of the total revenue in FY18 and in FY17.
Moreover, the company has achieved a significant growth path from FY14 top-line of $13,839 million to $20,053 Mn in FY18, posting a CAGR growth of 9.7% over FY14-FY18. Bottom-line also improved from $180.15 Mn in FY14 to $300.6 Mn in FY18, witnessing a CAGR growth of 13.7% over the period of FY14-FY18.
.png)
Five Years Financial Highlights (Source: Company Reports
Recently, the company announced its 2Q 2019 earnings posting an excellent growth across the segments. Convergys, recently acquired, also supported the overall growth. Going forward, the company intends to maintain the growth momentum with continued capital expenditure.
Strong Performance for the Second Quarter of 2019: The company recently came out with the second quarter 2019 results which were better than expected in terms of topline & bottom line. For the quarter, SNX delivered a 63% increase in the consolidated gross profit to $698 million, compared to a year ago. The gross margin expanded by 346 basis points, which was more than 12% on pcp. The improvement in the gross profit dollars and the margin was on the back of several factors which include the positive contribution from the acquisition of Convergys and overall organic growth in the topline of the company. For the quarter, consolidated non-GAAP operating income grew by 60% to $244 million on yoy (year-on-year). Non-GAAP operating margin improved to 4.3% from pcp. The company reported Non-GAAP net income growth of 54% to $147 million on pcp, driven by the balanced contribution from both the segments.
For the second quarter of 2019, the company posted cash flow from operations of $108 million with capital expenditures of $24 million. During the quarter, SNX incurred the net total interest expense and finance charges of ~$43 million, higher than 16 million, incurred in the prior-year quarter. This rise was due to the increase in borrowings, which was required for funding the acquisition of Convergys and also for the growth of the Technology Solutions business. Depreciation expense came in at $43 million with amortization expense of $53 million. SNX’s trailing twelve months ROIC stood at 8.2% whereas adjusted ROIC came in at 10.8%.
At the end of the quarter, the company’s accounts receivable amounted to $3.5 billion with inventories of $2.6 million. Meanwhile, the cash conversion cycle for the quarter was 53 days, lower than 6 days as compared to the prior quarter, however, it was up by 12 days versus the corresponding period last year. SNX reported a 20.2% increase in the adjusted earnings per share of $2.86.
The company had reported the adjusted revenue growth of 17% (18% after adjusting the foreign exchange) to $5.72 billion in the second quarter of FY 19. Additionally, at the end of the quarter, on the transaction synergy front, the company’s annualized run rate for synergies was of about $85 million, higher than one-year target of $75 million. The company is now in the last major phase of integration of the Convergys acquisition, and focusing on the back office. For the third quarter of 2019, the company plans to shift most of the back-office functions in order to achieve additional synergies.
.png)
Second Quarter 2019 Financial Highlights (Source: Company Reports)
Segment-Wise Performance: Both segments, i.e., Technology Solutions and Concentrix performed well during the quarter with contributing towards the overall revenue of the company.
Technology Solutions delivered a 3.3% increase in the revenue to $4.6 billion from the $4.4 billion posted in the corresponding quarter last year. On the constant currency basis, a growth of 7% was seen in the gross revenue. Gross margin expanded 32 basis points to 5.9% during the quarter driven by the mix and balanced growth across the segment’s portfolio. Technology Solutions posted a 12% rise in the non-GAAP operating income to $124 million over the corresponding quarter last year. The adjusted operating margin also expanded by 21 basis points to 2.7% compared to a year ago.
The company’s other major segment, Concentrix, for the quarter, delivered the revenue growth of 136% to $1.2 billion on the back of the acquisition of Convergys. The company completed the acquisition of Convergys in October 2018. The segment posted a growth of 189% in the non-GAAP operating income to $120 million in terms of absolute dollars (yoy). The segment during the quarter saw an expansion of adjusted operating margin by 189 basis points to 10.3% from the prior-year period. The growth was seen in both profit dollars and margin on the back of the newly acquired Convergys.
Capital Management: During the second quarter of 2019, SNX repurchased more than $15 million value of shares, which means the company repurchased 160,000 shares in the second quarter. Further, the company declared the quarterly cash dividend of $0.375 per common share. This dividend will be paid on July 26, 2019 to its shareholders those who are on record at the close of the business on July 12, 2019.
Top 10 Shareholders: The top 10 shareholders have been highlighted in the table which together form around 40.23% of the total shareholding. Mitac International Corp and Fidelity Management & Research Company hold the maximum interest in the company at 17.77% and 13.96%, respectively.
.png)
Top 10 Shareholders (Source: Thomson Reuters)
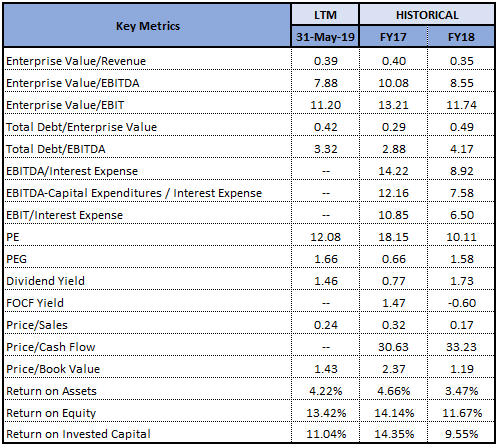
Key Metrics: The company posted healthy margins in the second quarter of FY19. Gross, EBITDA and net margins for 2QFY19 stood at 12.2%, 4.9%, and 2.0%, showing improvement as compared to 8.7%, 3.7% and 1.6%, respectively on yoy basis. Although, the margins witnessed an improvement, it remained below the industry median. ROE at 3.2% in the second quarter of FY19 was well-above the industry median of 2.8% and significantly improved on a sequential basis.
.png)
Key Metrics (Source: Thomson Reuters)
Future Outlook: For the third quarter of FY19, SNX projects the topline to be in the range of $5.55 billion and $5.85 billion. Non-GAAP net income for the 3QFY19 is projected to be between $144 million and $150 million. Non-GAAP diluted earnings per share are anticipated in the range of $2.80 and $2.92. These forecasts are based on weighted average outstanding shares of about 51 million. For 3QFY19, the company anticipates its quarterly net total interest expense and finance charges to be ~$42 million and effective tax rate to be about 27%.
Moreover, SNX anticipates capital spending to rise during the second half of the year 2019. On a long-term basis, the company projects that capital spending in the business will remain ~3% of the topline. The company, during 3QFY19, anticipates the integration to be continued to achieve the synergy targets and the ramping of new client wins.
Key Valuation Metrics (Source: Thomson Reuters)
The company also expects that the general seasonal cycle of Concentrix’s revenue and profit will be continued as usual. Apart from the profitability gains from the attainment of further synergy in the third quarter of 2019, SNX will increase the investment in client programs to underpin sequential growth in the revenue for the fourth quarter. Therefore, for the third quarter, for Concentrix, SNX anticipates that all key parameters will be above the expectations. The key parameters are comprised of the integration of Convergys, the growth in topline, new logos, management of expenses and cash flow generation. SNX also anticipates that its overall business will deliver results in-line with the historical cycle for the third quarter of 2019 and it will able to achieve double-digit growth in the non-GAAP operating profit margin.
For the Technology Solutions segment, SNX anticipates that third quarter performance will be consistent with seasonal norms, which will be on a gross revenue basis, which means that SNX will be able to repeat the same growth on a net revenue basis as delivered in the second quarter of 2019. Within the Technology Solutions segment, it expects that the performance of the tech sector and its channel will remain healthy and attract a reasonable demand.
Valuation Methodology:
Method 1: PE Based Valuation (NTM):
.png)
PE-Based Valuation (Source: Thomson Reuters), *NTM-Next Twelve Months
Method 2: Price to Cash Flow Based Valuation (NTM):
.png)
Price to Cash Flow Based Valuation (Source: Thomson Reuters), *NTM-Next Twelve Months
Note: All forecasted figures and peers have been taken from Thomson Reuters, *NTM-Next Twelve Months
Stock Recommendation: SNX stock is trading at a price of $100.09, has support at around $90.40 level and resistance at ~$109.6. The company for the second quarter of 2019 achieved better than expected performance and has a positive view for overall markets condition in which both the segment, Concentrix and Technology Solutions operate. The company is also optimistic for its segment’s balanced portfolio and the geographic reach for further growth to be continued. Based on the foregoing, we have valued the stock using the two relative valuation methods, Price Earnings multiple and Price to Cash Flow multiple, and arrived at the target price in the ambit of $124.03 to $126.40 (double-digit upside (%)). Hence, we recommend a “Buy” rating on the stock at the current market price of $100.09 per share, up 0.46% on 03 July 2019.
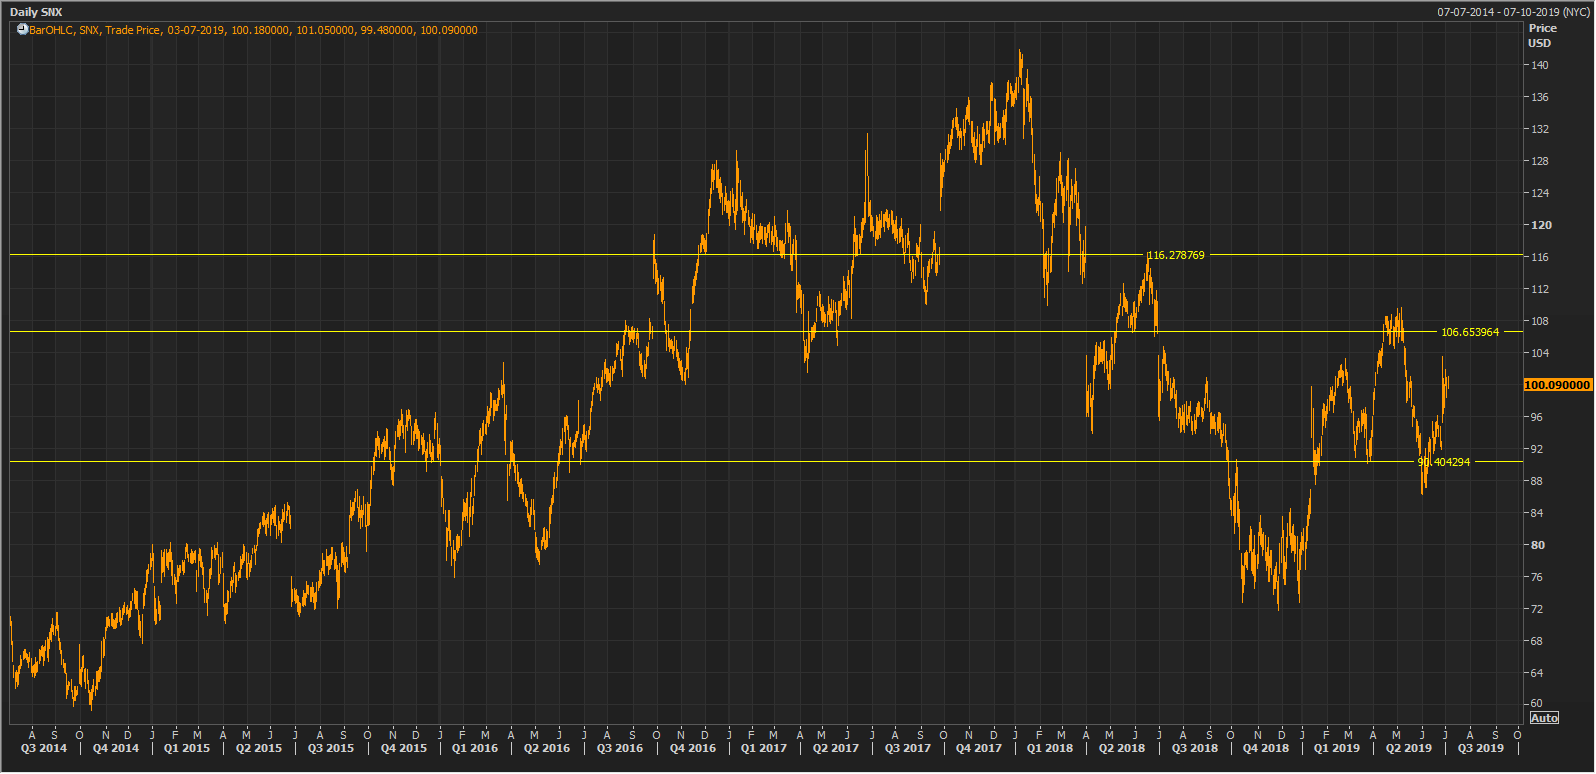
SNX Daily Chart (Source: Thomson Reuters)
Disclaimer
The advice given by Kalkine Pty Ltd and provided on this website is general information only and it does not take into account your investment objectives, financial situation or needs. You should therefore consider whether the advice is appropriate to your investment objectives, financial situation and needs before acting upon it. You should seek advice from a financial adviser, stockbroker or other professional (including taxation and legal advice) as necessary before acting on any advice. Not all investments are appropriate for all people. Kalkine.com.au and associated pages are published by Kalkine Pty Ltd ABN 34 154 808 312 (Australian Financial Services License Number 425376). The information on this website has been prepared from a wide variety of sources, which Kalkine Pty Ltd, to the best of its knowledge and belief, considers accurate. You should make your own enquiries about any investments and we strongly suggest you seek advice before acting upon any recommendation. Kalkine Pty Ltd has made every effort to ensure the reliability of information contained in its newsletters and websites. All information represents our views at the date of publication and may change without notice. To the extent permitted by law, Kalkine Pty Ltd excludes all liability for any loss or damage arising from the use of this website and any information published (including any indirect or consequential loss, any data loss or data corruption). If the law prohibits this exclusion, Kalkine Pty Ltd hereby limits its liability, to the extent permitted by law to the resupply of services. There may be a product disclosure statement or other offer document for the securities and financial products we write about in Kalkine Reports. You should obtain a copy of the product disclosure statement or offer document before making any decision about whether to acquire the security or product. The link to our Terms & Conditions has been provided please go through them and also have a read of the Financial Services Guide. On the date of publishing this report (mentioned on the website), employees and/or associates of Kalkine Pty Ltd do not hold positions in any of the stocks covered on the website. These stocks can change any time and readers of the reports should not consider these stocks as personalised advice.