Company Overview: Expedia Group, Inc., formerly Expedia, Inc., is an online travel company. The Company operates through four segments: Core Online Travel Agencies (Core OTA), trivago, Egencia and HomeAway. The Company's Core OTA segment provides a range of travel and advertising services to its customers across the world, through a range of brands, including Expedia.com and Hotels.com in the United States, and localized Expedia and Hotels.com Websites throughout the world, Orbitz.com, Expedia Affiliate Network, Hotwire.com, Travelocity, Wotif Group, CarRentals.com and Classic Vacations. The Company's trivago segment sends referrals to online travel companies and travel service providers from its hotel metasearch Websites. Its Egencia segment, which also includes Orbitz Worldwide (Orbitz) for Business, provides managed travel services to corporate customers across the world. The Company's HomeAway segment operates an online marketplace for the vacation rental industry.
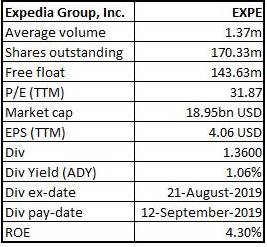
EXPE Details
Decent top-line growth in 2Q aided by higher bookings from Core OTA segment: Expedia Group, Inc. (NASDAQ: EXPE) is one of the world’s largest online travel companies with gross bookings representing ~6% of total worldwide travel spending. The company continues to build, a broad and deep supply portfolio which includes over 1 million properties. The company has more than 370,000 of HomeAway's over 1.8 million online bookable vacation rental listings, over 500 airlines and numerous car rental companies, cruise companies and other travel suppliers. The company has tie-ups with several hotels and owns brands - Expedia®, Hotels.com®, Expedia® Partner Solutions, Vrbo®, Egencia®, trivago®, HomeAway®, Orbitz®, Travelocity®, Hotwire®, Wotif®, etc. EXPE offers its services with four reportable segments, which include Core OTA, trivago, HomeAway, and Egencia. The company consistently aims to drive the customer demand by strengthening the brand portfolio, enhanced product offerings, new channel penetration, etc. In combination with global scale and broad-based supply, EXPE provides a unique advantage to its customers to address the ongoing migration of travel bookings from offline to online around the world. Primary growth drivers for Expedia Group are global expansion, including supply portfolio, technology and product innovation, and new channel penetration and expansion.
Looking at the past performance from FY14 to FY18, the company recorded a 5-year CAGR growth of 18.1% for revenue, which amounted to $11,223 million in FY18 from $5,763 million in FY14. Profitability witnessed a 5-year CAGR growth of 0.5% for the period of FY14-FY18. The company’s total gross bookings also saw a strong momentum and witnessed a CAGR growth of 12.8% to $ 99,727 million in FY18 from $78,411 million in FY16. However, total revenue margin was broadly flat at 11.3% in FY18 from 11.2% in FY16.
Going forward, with a strong brand portfolio, unmatched global audience of travelers, continuous efforts to expand its global reach, adoption of cost-effective measures, etc., the company is on the path of long-term success.
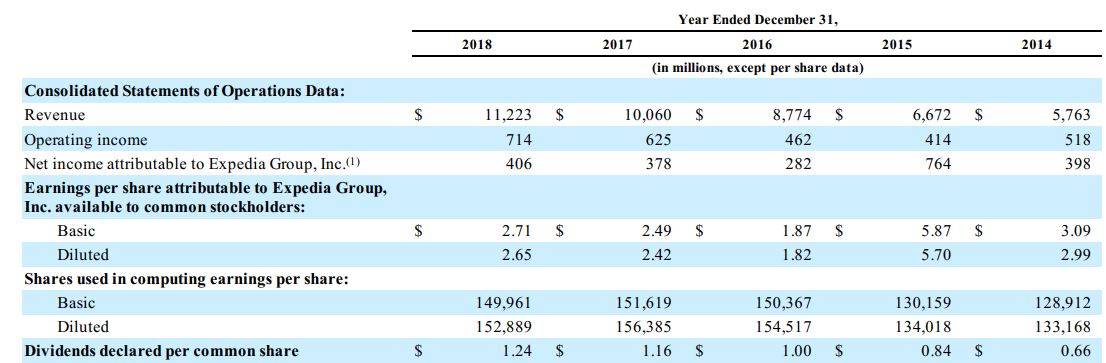
Historical Performance FY14-FY18 (Source: Company Reports)
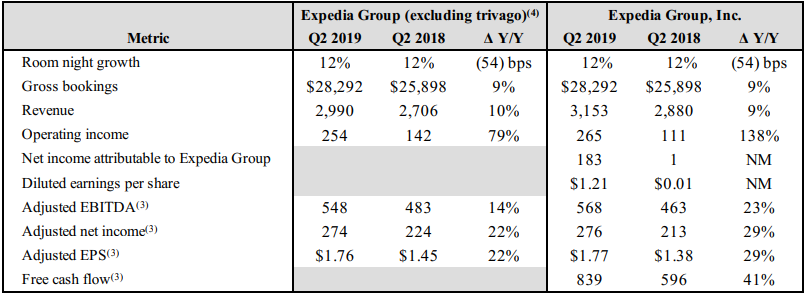
Q2FY19 Highlights: The company posted its Q2FY19 revenue at $3,153 million, an increase of 9% on y-o-y while net income came in at $183 million. Adjusted EBITDA during the quarter, stood at $568 million, 23% higher than Q2FY18 EBITDA of $463 million. The company reported a rise of 9% (y-o-y) in gross bookings to $28,292 million, primarily driven by growth in Expedia Partner Solutions, Brand Expedia and Vrbo. Domestic revenue increased by 13% and international revenue increased by 5% (including foreign exchange impact of 6%).
Total stayed lodging room nights increased 12%, and Vrbo stayed property nights grew 8%, during the quarter. EXPE reported core lodging platform of 1.3 million properties as of June 30, 2019, which include 5,70,000 integrated Vrbo listings. Lodging accounted for 71% of total revenue, followed by advertising and media for 9%, air for 7% and other revenues representing the remaining 13%.
Q2FY19 Financial Highlights (Source: Company reports)
Cost and Expenses Analysis: As a % of revenue, selling and marketing expenses, during the quarter, accounted for ~52.6%, followed by the cost of revenue, technology and content, and general & administrative expenses, which represented ~16.6%, 13.8% and 6.8%, respectively. The company reported a cost of revenue of $522 million, implying a rise of 5% from the prior corresponding quarter. While, selling & marketing and technology & content expenses came in at $1,657 million and $ 435 million, respectively during the quarter. General and administrative expense at $214 million during Q2FY19 was 9% higher than Q2FY18.
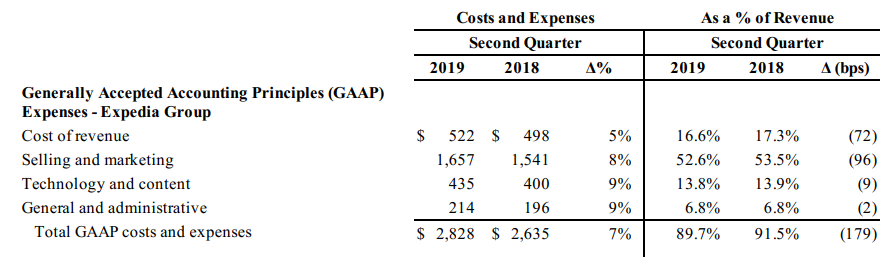
Costs and Expenses (Source: Company Reports)
Segment-Wise Performance: The company posted decent growth across the segments, and the overall growth was largely supported by its larger contributor to revenue, i.e., Core OTA. The segments, along with the decent growth, witnessed developments to maintain the market share and for further revenue generation.
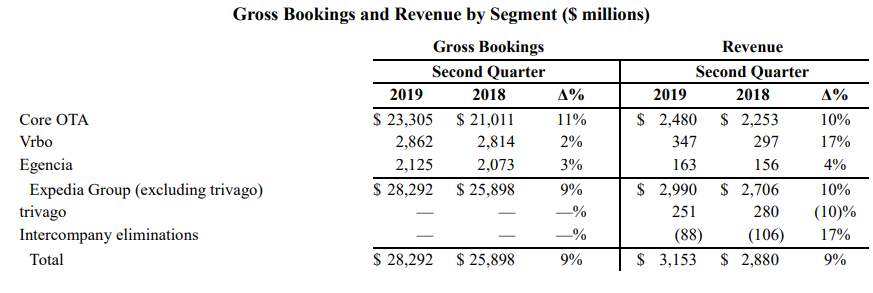
Segment Break-up (Source: Company Reports)
Core OTA- The segment reported gross bookings of 23,305, up 11% on y-o-y, while revenue stood at $2,480 million, a rise of 10% from Q2FY18. The segment is responsible for the major chunk (~76.52%) of the total revenue. Adjusted EBITDA came in at $623 million, up 11% pcp. Brand Expedia is partnering with Malaysia Airlines, which will provide a fully digitalized travel program exclusively for student where the students will enjoy a benefit of 8% off across domestic hotels and 10% off international hotels. Hotels.com has done brand campaigning across 11 countries during the quarter.
Vrbo- During Q2FY19, the segment grew by 17% (y-o-y) in terms of revenue to $347 million and reported gross bookings of $2,862 million, an increase of 2% on y-o-y. Adjusted EBITDA stood at $84 million, up 8% on pcp. Currently, Vrbo offers more than 2 million online bookable listings and introduced Boost, a solution which would improve listings’ search position.
Egencia- The segment contributed 7.51% and 5.03% in gross bookings and total revenue, respectively. Revenue came in at $163 million, 4% higher than prior corresponding year, followed by gross bookings at $2,125 million, up 3% on y-o-y. The segment reported an adjusted EBITDA of $37 million, up 24% on y-o-y. Egencia's recently launched Smart Mix for Air saves travelers and travel arrangers time by using machine learning to sort flights according to a traveler’s preference on duration, number of stops, price, etc.
Balance Sheet, Cash Flows and Capitalization- Cash & cash equivalents and short-term investments, cumulatively amounted to $5.5 billion as on June 30, 2019. Long-term investments and other assets were calculated at $133 million as on June 30, 2019. The company reported long-term debt, net of applicable discounts, debt issuance costs and current maturities, at $3.7 billion at June 30, 2019. EXPE reported an unsecured revolving credit facility at $2 billion. Consolidated amortization of intangible assets came lower at $52 million during Q2FY2019, compared to $72 million in Q2FY18, due to the completion of amortization related to certain intangible assets. Shareholders equity as on 30 June 2019 stood at $5,907 million.
EXPE reported net cash used in investing activities at $1,116 million, while cash from operating activities came in at $3,287 million at the end of the period. Year-to-date, net cash provided by operating activities and free cash flow grew 32% and 31%, respectively.
During Q2FY19, the Board announced $0.34 of dividend for each common share held with a payment date of 12 September 2019.
Taxation: Tax rate under GAAP was 20% for the quarter against 34% in the previous corresponding quarter. The reduction in the effective rate was mainly due to an impact from non-deductible goodwill impairment during Q2FY18 and tax benefits current year, partly offset by an increase in U.S. taxable income. The effective tax rate on pretax adjusted net income, during this quarter, came in at ~22% against ~16% in the previous corresponding year, due to an increase in the U.S. taxable income.
Strategic collaboration with Lufthansa: During 2QFY19, EXPE collaborated with the Lufthansa Group airlines for enhancing more travelling options across several airlines like Lufthansa, SWISS and Austrian Airlines on Expedia Group sites including Brand Expedia, ebookers, and Egencia. The above-stated companies collaborated with each other and incorporated industry-leading New Distribution Capability (NDC) direct API connection to enhance the customer experience.
Key Metrics: The company posted decent margins during 2QFY19. Gross margin, EBITDA margin and net margin for 2QFY19 stood at 83.4%, 15.9% and 5.9%, well above the industry median of 52.5%, 3.8% and 2.3%, respectively.ROE at 4.3% was also higher than the industry median of 1.2% during the quarter, displaying that the company is generating better returns for its shareholders than its peers.
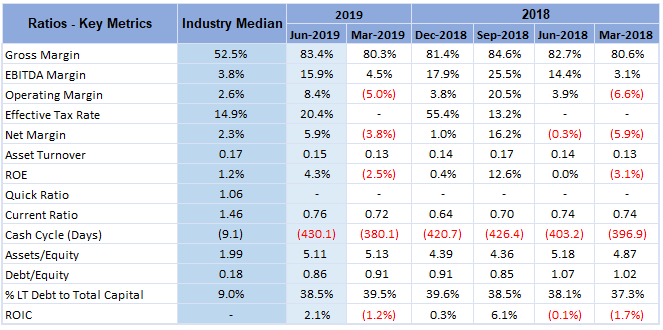
Key Ratio Metrics (Source: Thomson Reuters)
Top 10 Shareholders: The top 10 shareholders have been highlighted in the table, which together form around 45.05% of the total shareholding. The Vanguard Group, Inc. and Liberty Expedia Holdings, Inc. hold the maximum interest in the company at 7.83% and 7.03%, respectively.
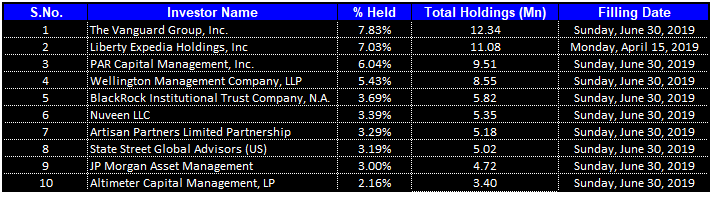
Top 10 Shareholders (Source: Thomson Reuters)
Latest Updates:
(a) As per the market update on 23 August 2019, EXPE informed that it will take participation in the Citi 2019 Global Technology Conference which will be held in New York, on 5 September 2019. As informed, Alan Pickerill, Executive Vice President and Chief Financial Officer will hold a question and answer session.
(b) Recently, with a media update, EXPE confirmed its acquisition of Liberty Expedia in an all-stock transaction. As per the transaction, Barry Diller, Chairman and Senior Executive of Expedia Group, and his family foundation, exchanged shares of common stock of Expedia Group for shares of Expedia Group Class B common stock held by Liberty Expedia. Mr. Diller and his family foundation remain the largest voting shareholder of Expedia Group, owning shares representing ~28% of the total voting power of Expedia Group. Following the close of the transaction, EXPE will reduce its share count by approximately 3.1 million shares and will no longer be a controlled company under applicable NASDAQ rules.
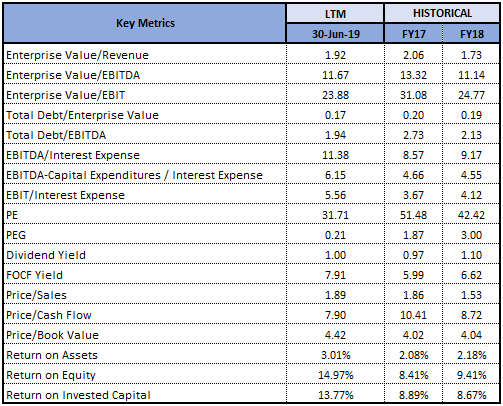
Key Valuation Metrics (Source: Thomson Reuters)
Valuation Methodologies:
Method 1: Price to Earnings Based Valuation (NTM):
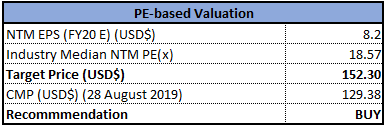
Price/Earnings Based Valuation (Source: Thomson Reuters), *NTM-Next Twelve Months
Method 2: Price to Book Value Based Valuation (NTM):
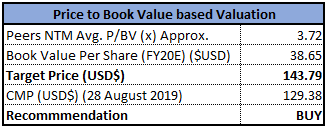
Price/Book Value Based Valuation (Source: Thomson Reuters), *NTM-Next Twelve Months
Note: All forecasted figures and peers have been taken from Thomson Reuters, *NTM-Next Twelve Months
Stock Recommendation: The stock of EXPE closed at $129.38 on 28 August 2019. The 52-week trading range of the stock stands at $108.11 to $144. The stock has recovered ~19.67% from the lower end of its 52-week trading range. At the current market price, EXPE is available at a P/E multiple of 31.87x with an annualized dividend yield of ~1.06%. The company showed strong bookings growth across Core OTA and Vrbo segments. Looking at the developments, recent collaboration with the leading airline, etc., we believe EXPE will drive higher volume growth in flight bookings segment in the upcoming times.
Considering the aforesaid factors, we have valued the stock using two relative valuation methods, Price to Earnings multiple and Price to Book Value multiple and have arrived at the target price upside in the ambit of $143.79 to $152.30 (lower double-digit growth (in %)). Hence, we recommend a ‘Buy’ rating on the stock at the current market price of $129.38, up 0.72% on 28 August 2019.
.png)
EXPE Daily Technical Chart (Source: Thomson Reuters)
Disclaimer
The advice given by Kalkine Pty Ltd and provided on this website is general information only and it does not take into account your investment objectives, financial situation or needs. You should therefore consider whether the advice is appropriate to your investment objectives, financial situation and needs before acting upon it. You should seek advice from a financial adviser, stockbroker or other professional (including taxation and legal advice) as necessary before acting on any advice. Not all investments are appropriate for all people. Kalkine.com.au and associated pages are published by Kalkine Pty Ltd ABN 34 154 808 312 (Australian Financial Services License Number 425376). The information on this website has been prepared from a wide variety of sources, which Kalkine Pty Ltd, to the best of its knowledge and belief, considers accurate. You should make your own enquiries about any investments and we strongly suggest you seek advice before acting upon any recommendation. Kalkine Pty Ltd has made every effort to ensure the reliability of information contained in its newsletters and websites. All information represents our views at the date of publication and may change without notice. To the extent permitted by law, Kalkine Pty Ltd excludes all liability for any loss or damage arising from the use of this website and any information published (including any indirect or consequential loss, any data loss or data corruption). If the law prohibits this exclusion, Kalkine Pty Ltd hereby limits its liability, to the extent permitted by law to the resupply of services. There may be a product disclosure statement or other offer document for the securities and financial products we write about in Kalkine Reports. You should obtain a copy of the product disclosure statement or offer document before making any decision about whether to acquire the security or product. The link to our Terms & Conditions has been provided please go through them and also have a read of the Financial Services Guide. On the date of publishing this report (mentioned on the website), employees and/or associates of Kalkine Pty Ltd do not hold positions in any of the stocks covered on the website. These stocks can change any time and readers of the reports should not consider these stocks as personalised advice.