Company Overview: Nuix Limited (ASX: NXL) provides an analytics and data software suite of products. Its products include Nuix Discover, Nuix Investigate, Nuix Workstation, Nuix Adaptive Security, and Nuix Enterprise Collection Centre. This Report covers the Price Action, Technical Indicators Analysis along with the Support Levels, Resistance Levels, and Recommendations on this stock.
Recent Updates:
During 1HFY24 (for the half year ended 31st December 20223), the company reported statutory revenue of AUD 98.40mn, up 12.3% YoY primarily driven by additional sales to existing customers. Also, annual contract value (ACV) grew by 17.3% to AUD 199.6mn mainly due to higher subscription ACV. During the year, NXL’s underlying EBITDA stood at AUD 28.4mn, up 12.8% YoY mainly due to increased gross profit but partially offset by increased operating expenses. However, the company has reported a net loss after tax of AUD 4.8mn as compared to net profit of AUD 1.3mn in 1HFY23.
Notably, NXL has registered underlying free cash flow of AUD 6.6mn in 1HFY24 as compared to - AUD 0.5mn in 1HFY2. The company is also negotiating with global banks to provide an AUD 30mn credit facility for general corporate purposes and Nuix's growth plans.
During 1HFY24, the company launched Nuix Neo, an AI technology platform used to identify, process and understand complex data. NXL collaborated with a small number of early adopters in FY24 with an average Neo ACV of more than AUD 5,00,000 per customer. For the full year 2024, NXL expects statutory EBITDA to be in the range of AUD 55 to 60mn, which is higher than the company’s previous update. However, the company anticipates underlying EBITDA to remain unchanged at AUD 63 to 68mn for FY24. Additionally, the company is targeting ACV and statutory revenue growth of around 10% in constant currency for FY24.
NXL’s Technical Analysis:
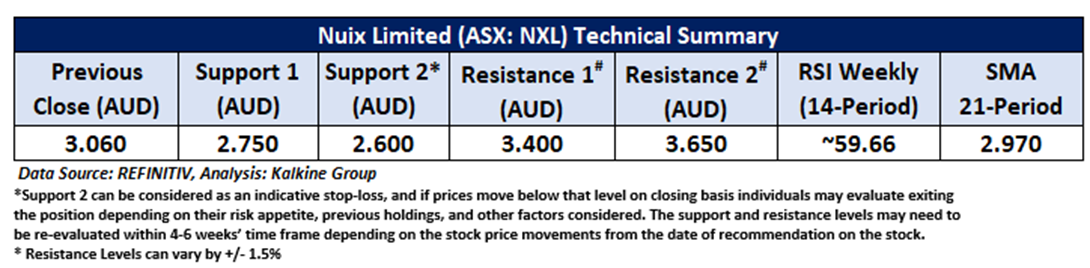
On the daily chart, NXL prices are sustaining above the rising trendline breakout level and taking support from the support zone. Moreover, the momentum oscillator RSI (14-period) is showing a reading of ~59.66 level. Furthermore, the prices are trading above the trend-following indicator 21-period SMA, which may act as a support level. An important support level for the stock is placed at AUD 2.75, while the key resistance level is placed at AUD 3.40.

Daily Technical Chart – NXL
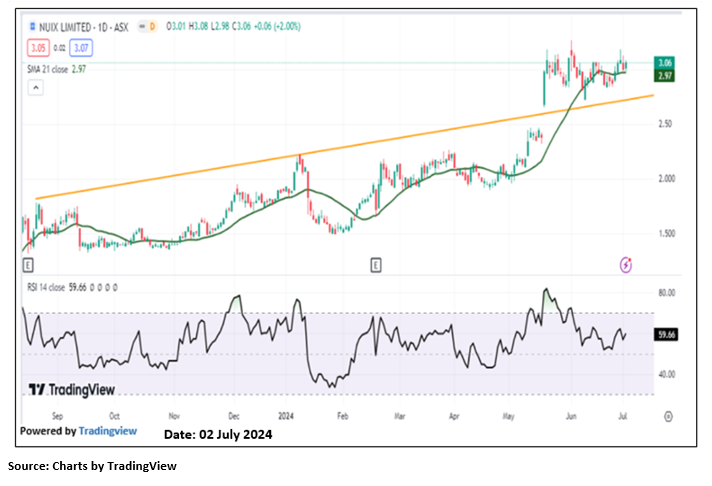
Considering the stock’s current price levels breaking above a rising trendline, and momentum oscillator analysis, a “Speculative Buy” recommendation is given on the stock. The stock was analysed as per the closing price of AUD 3.06 per share as of 02 July 2024, up by 2.00%. Nuix Limited (ASX: NXL) was last covered in a report dated ’27 July 2023’.
Note 1: Past performance is neither an Indicator nor a guarantee of future performance.
Note 2: Investment decision should be made depending on an individual’s appetite for upside potential, risks, and any previous holdings. This recommendation is purely based on technical analysis, and fundamental analysis has not been considered in this report.
Note 3: Related Risks: This report may be looked at from high-risk perspective and recommendations are provided are for a short duration. Recommendations provided in this report are solely based on technical parameters, and the fundamental performance of the stocks has not been considered in the decision-making process. Other factors which could impact the stock prices include market risks, regulatory risks, interest rates risks, currency risks, social and political instability risks etc.
The reference date for all price data, currency, technical indicators, support, and resistance levels is July 02, 2024. The reference data in this report has been partly sourced from REFINITIV.
Technical Indicators Defined:
Support: A level at which the stock prices tend to find support if they are falling, and a downtrend may take a pause backed by demand or buying interest. Support 1 refers to the nearby support level for the stock and if the price breaches the level, then Support 2 may act as the crucial support level for the stock.
Resistance: A level at which the stock prices tend to find resistance when they are rising, and an uptrend may take a pause due to profit booking or selling interest. Resistance 1 refers to the nearby resistance level for the stock and if the price surpasses the level, then Resistance 2 may act as the crucial resistance level for the stock.
Stop-loss: It is a level to protect further losses in case of unfavourable movement in the stock prices.
The Green colour line reflects the 21-period moving average. SMA helps to identify existing price trends. If the prices are trading above the 21-period, prices are currently in a bullish trend (Vice – Versa).
The Blue colour line reflects the 50-period moving average. SMA helps to identify existing price trends. If the prices are trading above the 50-period, prices are currently in a bullish trend (Vice – Versa).
The Orange/ Yellow colour line represents the Trendline.
The Purple colour line in the chart’s lower segment reflects the Relative Strength Index (14-Period), which indicates price momentum and signals momentum in trend. A reading of 70 or above suggests overbought status, while a reading of 30 or below suggests an oversold status.
 AU
AU

 Please wait processing your request...