Company Overview: BPH Energy Limited (ASX: BPH) invests in biotechnology, oil and gas exploration and development, and medicinal cannabis industries, which builds a system to generate clean hydrogen and conductive carbon used to manufacture batteries for commercial use. This Report covers the Price Action, Technical Indicators Analysis along with the Support Levels, Resistance Levels, and Recommendations on this stock.
BPH’s Technical Analysis:
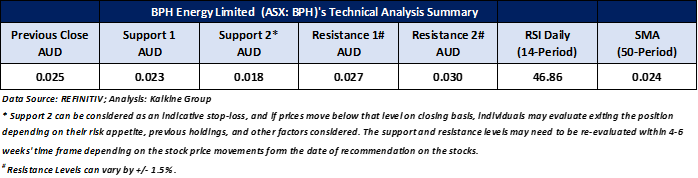
On the daily chart, BPH's stock price fluctuates between a symmetrical triangle pattern which has been established since July 2022, inclining to a positive trend. Additionally, the stock recently crossed above the trend-following indicator 50-day SMA, providing further support for the mentioned recommendation. Prices are oscillating between its previous peak and trough, which may potentially function as resistance and support levels for the stock, respectively. Important support for the stock is positioned at AUD 0.023, while key resistance is placed at AUD 0.027.

Daily Technical Chart – BPH
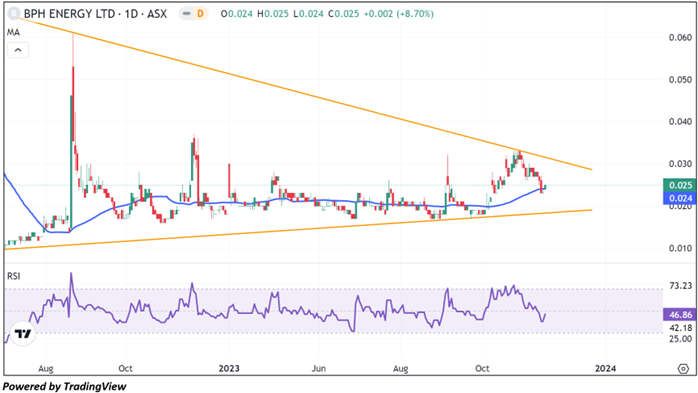
Considering the stock’s current price levels forming a symmetrical triangle pattern, and momentum oscillator analysis, a “Speculative Buy” recommendation is given on the stock. The stock was analysed as per the closing price of AUD 0.025 per share as on 15 November 2023, up by 8.70%. BPH Energy Limited (ASX: BPH) was last covered in a report dated ’19 July 2022’.
Disclosure: BPH Energy Limited (Company) is a client of Kalkine Media Pty Ltd (Kalkine Media), an affiliate of Kalkine. However, under no circumstances have Kalkine or its related entities been, directly or indirectly influenced in making any related insights concerning Company as contained in this report, and no form of compensation is or will be received by Kalkine, Kalkine Media or Kalkine’s other related entities for the publication of this report.
Markets are trading in a highly volatile zone currently due to certain macro-economic issues and geopolitical tensions prevailing. Therefore, it is prudent to follow a cautious approach while investing.
Note 1: Past performance is neither an Indicator nor a guarantee of future performance.
Note 2: Investment decision should be made depending on an individual’s appetite for upside potential, risks, and any previous holdings. This recommendation is purely based on technical analysis, and fundamental analysis has not been considered in this report.
Note 3: Related Risks: This report may be looked at from high-risk perspective and recommendations are provided are for a short duration. Recommendations provided in this report are solely based on technical parameters, and the fundamental performance of the stocks has not been considered in the decision-making process. Other factors which could impact the stock prices include market risks, regulatory risks, interest rates risks, currency risks, social and political instability risks etc.
The reference date for all price data, currency, technical indicators, support, and resistance levels is November 15, 2023. The reference data in this report has been partly sourced from REFINITIV.
Technical Indicators Defined:
Support: A level at which the stock prices tend to find support if they are falling, and a downtrend may take a pause backed by demand or buying interest. Support 1 refers to the nearby support level for the stock and if the price breaches the level, then Support 2 may act as the crucial support level for the stock.
Resistance: A level at which the stock prices tend to find resistance when they are rising, and an uptrend may take a pause due to profit booking or selling interest. Resistance 1 refers to the nearby resistance level for the stock and if the price surpasses the level, then Resistance 2 may act as the crucial resistance level for the stock.
Stop-loss: It is a level to protect further losses in case of unfavourable movement in the stock prices.
The Green colour line reflects the 21-period moving average. SMA helps to identify existing price trends. If the prices are trading above the 21-period, prices are currently in a bullish trend (Vice – Versa).
The Blue colour line reflects the 50-period moving average. SMA helps to identify existing price trends. If the prices are trading above the 50-period, prices are currently in a bullish trend (Vice – Versa).
The Orange/ Yellow colour line represents the Trendline.
The Purple colour line in the chart’s lower segment reflects the Relative Strength Index (14-Period), which indicates price momentum and signals momentum in trend. A reading of 70 or above suggests overbought status, while a reading of 30 or below suggests an oversold status.
 AU
AU

 Please wait processing your request...