CSL Limited
.png)
CSL Details
Trading at Higher Level: CSL Limited (ASX: CSL) is a global biotechnology leader which develops and delivers innovative medicines that save lives, protect public health and help people with life-threatening medical conditions live full lives. The strategic objective of the company is to maximize portfolio value & deliver new product launches. On the financial front, the Company has achieved a five-year compound annual growth (CAGR) in total operating revenue and bottom line of 6.0% and 7.2% respectively to FY18 while investment in R&D recorded CAGR growth of 9.4 percent over the same period. Moreover, for FY18, the company delivered a 29.3% rise in the PAT to US$1,728.9 Mn and 30.1% rise in the earnings per share (EPS) to US$3.822 against the prior year. This was mainly supported by total operating revenue growth of 13.9% (y-o-y) underpinned by new product launches, growth in the existing products, expansion of FLUAD manufacturing facility. The management expects that the group is on track to achieve 9% growth in revenue and underlying NPAT growth in between ~10% and 14% against FY18 on the back of ongoing investment strategy.
.png)
Five Year Financial Performance (Source: Company Reports)
Meanwhile, the stock has generated a positive YTD return of 42.020% and is currently trading around its 52-week high. Although there are numerous positive factors that would ensure better value to shareholders, we presume that at the current level, the price has discounted all the positive developments. In the near term, there could be some price correction in the stock. We, therefore, maintain our “Expensive” recommendation on the stock at the current market price of $ 200.020.
.png)
CSL Daily Chart (Source: Thomson Reuters)
Magellan Financial Group Limited
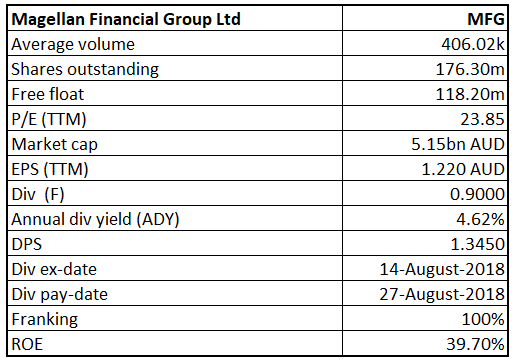
MFG Details
Mixed Updates:Magellan Financial Group Limited (ASX: MFG) has recently announced the appointment of Dr. Brett Cairns as a Chief and Managing Director and Mr. Hamish Douglass as a Chairman of the Board, effective from 5 October 2018. On the other hand, the group experienced net inflows of $86 million in September month, which included net retail inflows of $60 million and net institutional inflows of $26 million. While in August month, the Group experienced net inflows of $292 Mn, which included net retail inflows of $74 Mn and net institutional inflows of $218 Mn as of 31 August 2018. It equates slightly de-growth of (-0.1%) in total funds under Management from August 2018 to September 2018. It was mainly impacted by the de-growth of net inflow during the period. Moreover, the company disclosed the result of Annual General Meeting (AGM) wherein the shareholders of the company have approved several resolutions such as adoption of remuneration report and Re-elected Mr. Paul Lewis as a Director with 92.29% voting.
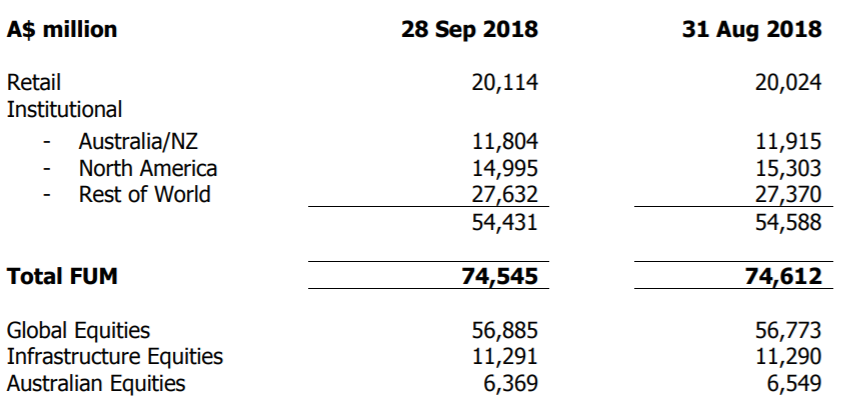
FUM as at September 2018 (Source: Company Reports)
Meanwhile, MFG stock has risen 31.02% in past three months as on October 04, 2018 and traded at reasonable PE level of 23.85x. Based on the foregoing, we maintain our “Hold” recommendation on the stock at the current price of $29.00.
.png)
MFG Daily Chart (Source: Thomson Reuters)
TPG Telecom Limited
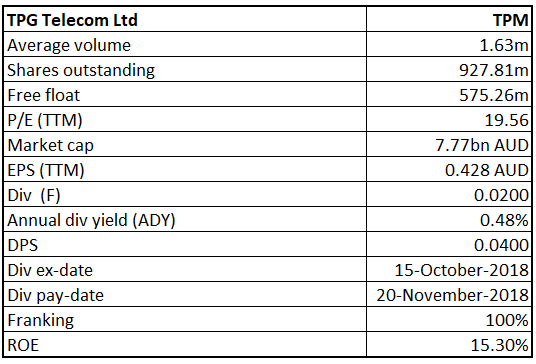
TPM Details
FY19 EBITDA Guidance: TPG Telecom Limited (ASX: TPM) is a leading telecom operator in Australia with the market capitalization of circa $7.77 Bn as of October 05, 2018. The Group delivered another strong cash flow result in FY18 with $868.3 Mn cash generated from operations (pre-tax). At the end of FY18, the Group had net debt of $1,266.4 Mn, which represents a leverage ratio of around 1.5x EBITDA, and had undrawn headroom of more than $1 billion in its debt facilities to fund its remaining planned mobile network investments in Australia and Singapore. Following this, TPM remains on track to achieve its milestone of outdoor service coverage by the end of 2018 in Singapore. The Group is expecting another year of EBITDA growth from its ‘business as usual’ (BAU) operations in FY19 but, as reflected in the flow chart below which indicates a bridge between actual FY18 EBITDA and estimated FY19 EBITDA from BAU operations, expects this to be offset by further gross profit margin headwinds as DSL and home phone services continue to migrate to the NBN and by a one-time step reduction in EBITDA caused by adoption of the new AASB15 revenue accounting standard. However, we believe that FY19 is still to be a year of EBITDA growth at the back of “business as usual” (BAU) operations. The group has given an EBITDA guidance in the range of $800 to $820 million for FY19.
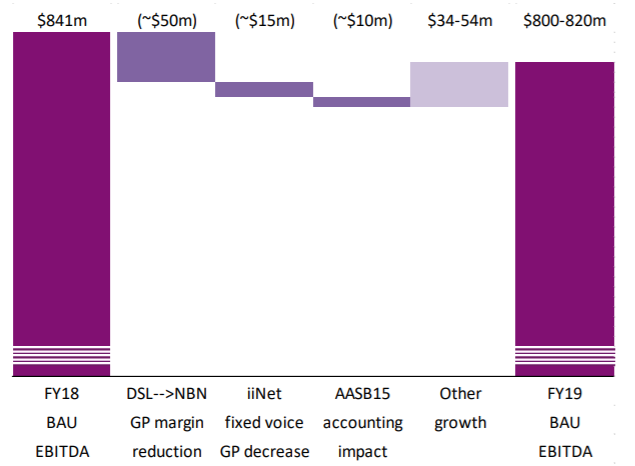
‘BAU’ EBITDA Flow Chart (Source: Company Reports)
From the analysis front, the company has consistently achieved higher Net Margins over the past five years in the range of 16% to 17.7%.For FY18, the net margin came in at 16.0% compared to the industry average of 8.3%. Over the period, the company has also generated a significant return for the shareholders with ROE at 15.3% against the industry average of 13.5%. Meanwhile, the stock has performed decent with YTD return of 28.18% and traded close to higher level.We, therefore, recommend a “Hold” on the stock at the current market price of $8.22 while merger with Vodafone Australia is being watched out for.
.png)
TPM Daily Chart (Source: Thomson Reuters)
Boral Limited
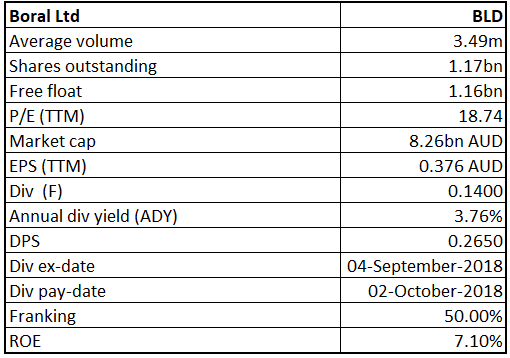
BLD Details
Decent Outlook Ahead:Boral Limited (ASX: BLD) has recently presented the business prospects of North America to members of the investment community in Atlanta (Georgia) and Lake Wales (Florida). According to the presentation, the transformation strategy of Boral North America is on track with three strong divisions and a robust balance sheet. It is very well placed in fly ash and building products, providing highly attractive growth opportunities in US markets. Boral North America contributes 35% shares of total underlying revenue of the Boral Group. The revenue of Boral North America has increased from $726 million in FY17 to $1,656 million in FY18. Boral North America’s EBITDA grew from $84 million to $284 million. Additionally, for FY 19, Boral North America expects the EBITDA growth of around 20% against FY18 numbers. The underlying market growth is expected around 5% in housing, around 2% in non-residential and around 6% in infrastructure.
.png)
Boral North America – FY18 Financial Performance (Source: Company Reports)
Meanwhile, the share price has risen 9.13 percent in the past three months (as at October 04, 2018) and traded at reasonable PE level of 18.74x. Hence, we maintain our “Buy” recommendation on the stock at the current market price of $6.860, considering a decent outlook ahead.
.png)
BLD Daily Chart (Source: Thomson Reuters)
Propel Funeral Partners Limited
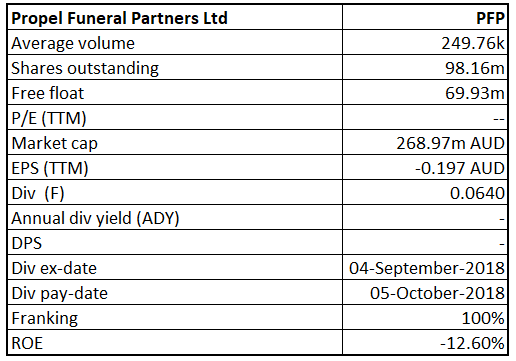
PFP Details
Steller performance in FY18: Propel Funeral Partners Limited (ASX: PFP) has recently released its full-year earnings report for the period ended 30 June 2018 wherein revenue grew by 76 percent and amounted to $80.9 Mn against the prior year. It was mainly driven by the 67% growth of funeral volumes and 5.5% growth of ARPF during the same period as compared to the prior year. EBITDA grew by 75% to $21.5 million in FY18 from $12.3 million in the previous year. Net Profit after Tax (NPAT) stood $12.3 Mn in FY18, exhibiting significant growth of 125 percent on a Y-o-Y basis. At 30 June 2018, the Group had a net cash of $28.3 Mn with no debt facility. Further, the Board of Directors declared a fully franked dividend of 6.4 cents per share (cps) with the dividend payout ratio of 80%. The dividend will be paid on 5 October 2018, with a record date of 5 September 2018 and an ex-dividend date of 4 September 2018. We believe that the company has a positive outlook on the back of continued growth expected from organic and inorganic growth.
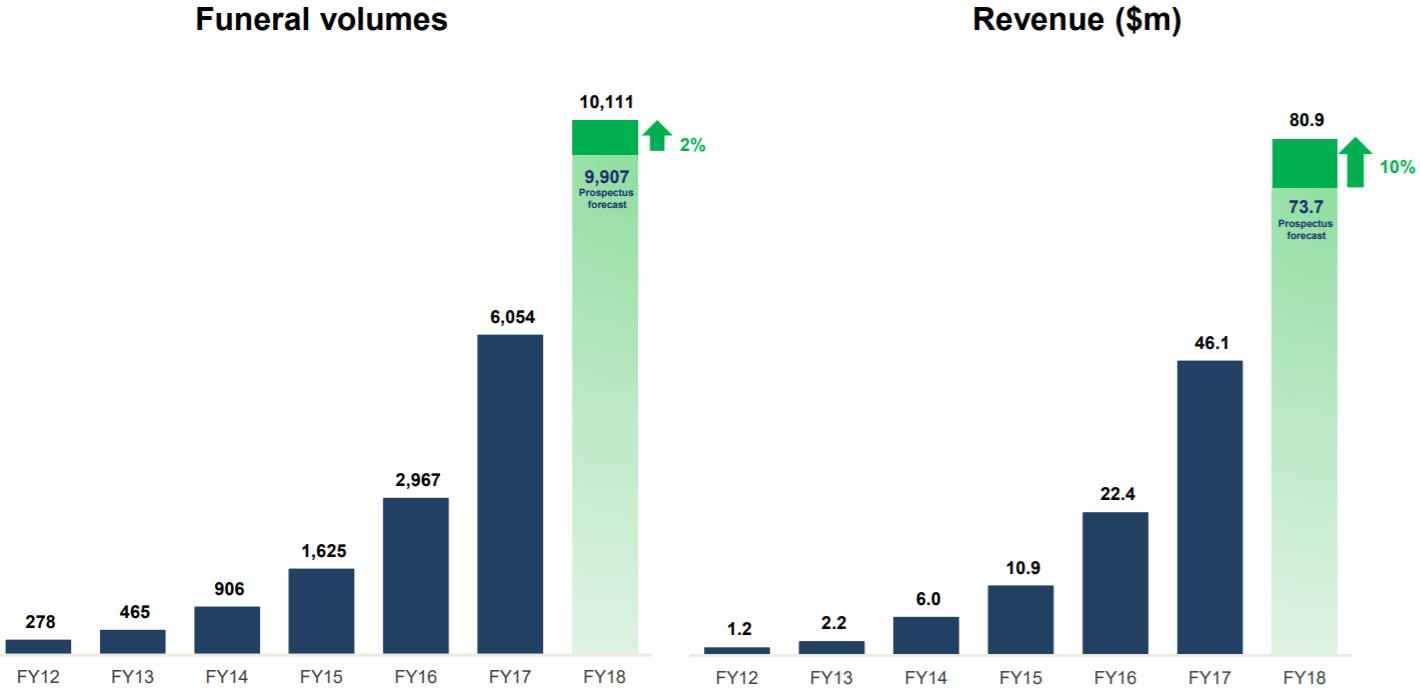
Funeral Volumes and Revenue Trend (Source: Company Reports)
Meanwhile, the share price has fallen 7.12 % in the past three months as at October 04, 2018 and traded at close to lower level. Based on foregoing, we maintain our “Speculative Buy” recommendation on the stock at the current market price of $2.760.
.png)
PFP Daily Chart (Source: Thomson Reuters)
Disclaimer
The advice given by Kalkine Pty Ltd and provided on this website is general information only and it does not take into account your investment objectives, financial situation or needs. You should therefore consider whether the advice is appropriate to your investment objectives, financial situation and needs before acting upon it. You should seek advice from a financial adviser, stockbroker or other professional (including taxation and legal advice) as necessary before acting on any advice. Not all investments are appropriate for all people. Kalkine.com.au and associated pages are published by Kalkine Pty Ltd ABN 34 154 808 312 (Australian Financial Services License Number 425376). The information on this website has been prepared from a wide variety of sources, which Kalkine Pty Ltd, to the best of its knowledge and belief, considers accurate. You should make your own enquiries about any investments and we strongly suggest you seek advice before acting upon any recommendation. Kalkine Pty Ltd has made every effort to ensure the reliability of information contained in its newsletters and websites. All information represents our views at the date of publication and may change without notice. To the extent permitted by law, Kalkine Pty Ltd excludes all liability for any loss or damage arising from the use of this website and any information published (including any indirect or consequential loss, any data loss or data corruption). If the law prohibits this exclusion, Kalkine Pty Ltd hereby limits its liability, to the extent permitted by law to the resupply of services. There may be a product disclosure statement or other offer document for the securities and financial products we write about in Kalkine Reports. You should obtain a copy of the product disclosure statement or offer document before making any decision about whether to acquire the security or product. The link to our Terms & Conditions has been provided please go through them and also have a read of the Financial Services Guide. On the date of publishing this report (mentioned on the website), employees and/or associates of Kalkine Pty Ltd do not hold positions in any of the stocks covered on the website. These stocks can change any time and readers of the reports should not consider these stocks as advice or recommendations.
 AU
AU

 Please wait processing your request...