
Stocks’ Details
Westpac Banking Corporation
A Look at December 2018 Quarter: Westpac Banking Corporation (ASX: WBC) had released the update for Q1 FY 2019 (period ended December 31, 2018). The bank stated that its Q1 FY 2019 unaudited cash earnings amounted to $2.04 billion which implies the rise of 6.9% as compared to the H2 FY 2018 quarterly average. However, in Q1 FY 2019, it does not include material remediation provisions as well as associated costs.
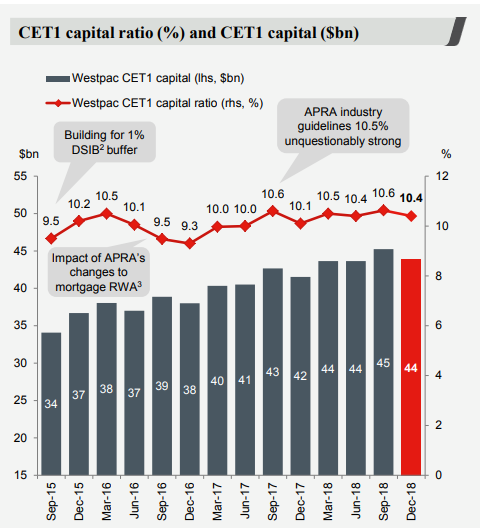
CET1 capital ratio (Source: Company Reports)
The bank’s common equity Tier 1 (or CET 1) capital ratio stood at 10.4% at December 31, 2018 which reflects a fall from 10.6% at September 30, 2018 because the capital which was generated in the quarter as well as other capital movements got more than offset by H2 FY 2018 dividend.
What to Expect From WBC: There are expectations that Westpac Banking Corporation would be supported by the deployments towards technology. The bank has been making investments towards technology so that the services to the customers can be improved as well as it becomes easier for the customers to do the business with the bank. The bank stated that service-led strategy would support it to create the value for the shareholders.
Stock Recommendation: On the monthly chart of Westpac Banking, Exponential Moving Average or EMA has been applied and default values were used for the purposes. There are expectations that the bank’s stock price might cross the EMA and, after the crossover, might move in the upward direction. However, this crossover has not yet occurred. If this crossover occurs, the bank’s stock price might witness a rise.
As a result, we maintain our “Buy” rating on the stock at the current market price of A$26.280 per share (marginal up by 0.465% on 18 February 2019).
Bendigo And Adelaide Bank Limited
Announcement About Interest Payment: Bendigo And Adelaide Bank Limited (ASX: BEN) has recently disclosed its interest payment of AUD 0.7242 with interest rate of 2.97 % per annum for BENHB - HYBRID 3-BBSW+1.00% PERP SUB CUM RED and it will be paid on May 30, 2019 with the record date of May 15, 2019 and ex-date of May 14, 2019.Recently, the company had declared it posted after-tax statutory profit amounting to $203.2 million in H1 FY 2019 which reflects the rise of 0.2% as compared to H2 FY 2018.
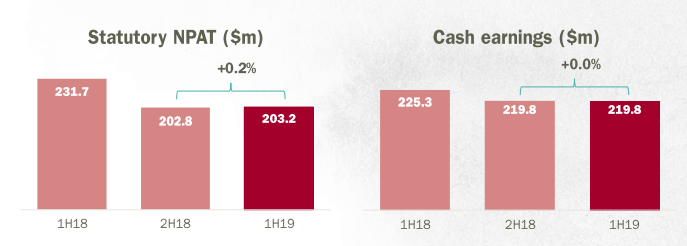
Statutory NPAT and Cash earnings (Source: Company Reports)
In H1 FY 2019, the bank posted underlying cash earnings amounting to $219.8 million and in H2 FY 2018, the figure was same i.e. $219.8 million. The key personnel of BEN had stated that results reflect robust customer loyalty as well as increasing customer growth, even though there is challenging operating as well as external environment, as the Bendigo And Adelaide Bank Limited executes on the vision of becoming Australia’s Bank of choice.
What to Expect From BEN: BendigoAnd Adelaide Bank Limited had stated that it would continue to work towards the strategy which revolves around the reduction of the complexity as well as cost by simplifying the functions, systems and processes. It would also work towards the ongoing assessment of the brand portfolio.The bank stated that its organic capital growth demonstrates the solid profitability, the stable balance sheet as well as ongoing movement to lower the risk exposures.
Stock Performance: Talking about the stock’s past performance, Bendigo And Adelaide Bank Limited’s stock had posted the return of -14.25% in the span of previous 6 months while in the previous three months, the stock had delivered the return of -2.28%. Also, the bank’s cash earnings have remained flat in H1 FY 2019 as compared to H2 FY 2018. Moreover, the bank’s total gross loans have witnessed a fall of 1% to $61.2 billion at the end of December 2018 as compared to $61.8 billion at the end of June 2018.
Based on the foregoing and current trading scenario, we have a watch stance on the stock at the current market price of A$9.810 per share and we advise to market players that they should wait for further growth catalysts.
WAM Capital Limited
Portfolio Update: WAM Capital Limited (ASX: WAM) had stated that its investment portfolio has witnessed a rise of 2.3% in January. WAM also added that the primary contributor to the performance of the portfolio happens to the include Credit Corp (ASX: CCP). During January, Credit Corp had made an announcement that it had witnessed a rise of 13% in the net profit after tax for H1 FY 2019. As depicted in the following picture, the company had also provided a list of top 20 holdings in the alphabetical order.
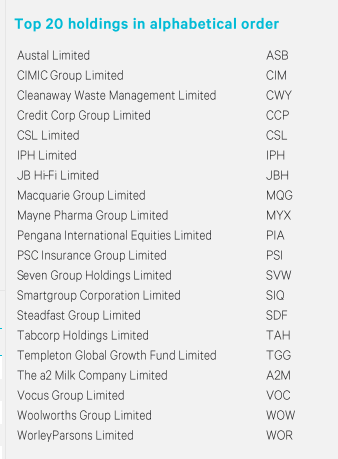
Top 20 Holdings (Source: Company Reports)
What to Expect From WAM: WAM had stated that the US division as well as consumer lending business of Credit Corp would be witnessing double-digit earnings growth in the next few years. WAM Capital also added that in the previous few years, IDP Education has made deployments towards the new digital platform to introduce the computer-delivered IELTS tests. According to WAM, this global platform could drive the volumes in the new tests as well as improve the margins of IEL in the next few years.
Moving forward, the performance of WAM is expected to be sensitive to the performance of the companies which are present in its portfolio.
Stock Recommendation: On the monthly chart of WAM Capital, Exponential Moving Average or EMA has been applied and default values can be used for the purposes. After careful observation, it was noticed that the stock price had crossed EMA and had trended downwards after the crossover. However, the stock price is now trending towards the EMA. The crossover has not occurred yet. If the crossover occurs, the stock price might witness a rise.
However, the stock of WAM Capital had delivered the return of -13.31% in the span of previous 6 months and, in the previous three months, the return was -6.93% and is trading at reasonable PE level of 11.14x.
Based on the above-mentioned factors, we maintain our “Speculative Buy” rating on the stock at the current market price of A$2.160 per share (marginal up by 0.465% on 18 February 2019).
.PNG)
Stock Price Comparative Chart (Source: Thomson Reuters)
Disclaimer
The advice given by Kalkine Pty Ltd and provided on this website is general information only and it does not take into account your investment objectives, financial situation or needs. You should therefore consider whether the advice is appropriate to your investment objectives, financial situation and needs before acting upon it. You should seek advice from a financial adviser, stockbroker or other professional (including taxation and legal advice) as necessary before acting on any advice. Not all investments are appropriate for all people. Kalkine.com.au and associated pages are published by Kalkine Pty Ltd ABN 34 154 808 312 (Australian Financial Services License Number 425376). The information on this website has been prepared from a wide variety of sources, which Kalkine Pty Ltd, to the best of its knowledge and belief, considers accurate. You should make your own enquiries about any investments and we strongly suggest you seek advice before acting upon any recommendation. Kalkine Pty Ltd has made every effort to ensure the reliability of information contained in its newsletters and websites. All information represents our views at the date of publication and may change without notice. To the extent permitted by law, Kalkine Pty Ltd excludes all liability for any loss or damage arising from the use of this website and any information published (including any indirect or consequential loss, any data loss or data corruption). If the law prohibits this exclusion, Kalkine Pty Ltd hereby limits its liability, to the extent permitted by law to the resupply of services. There may be a product disclosure statement or other offer document for the securities and financial products we write about in Kalkine Reports. You should obtain a copy of the product disclosure statement or offer document before making any decision about whether to acquire the security or product. The link to our Terms & Conditions has been provided please go through them and also have a read of the Financial Services Guide. On the date of publishing this report (mentioned on the website), employees and/or associates of Kalkine Pty Ltd do not hold positions in any of the stocks covered on the website. These stocks can change any time and readers of the reports should not consider these stocks as advice or recommendations.
 AU
AU
 Please wait processing your request...