Regression Analysis
Updated on 2023-08-29T11:55:55.134165Z
What is Regression Analysis?
Regression Analysis explains the relationship between the dependent & the independent variables. It also helps to predict the mean value of the dependent variable when we specify the value for independent variables. Through regression analysis, we make a regression equation where the coefficient in the equation represents the relationship between each independent and dependent variable.
Mathematical interpretation of Regression Analysis:
Mathematically, regression analysis can be represented using the below formula.
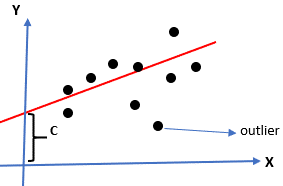
Y = mX + C
- Y - dependent variable/response variable
- X - independent variable/predicator variable
- m - coefficient
- C - constant or intercept
In this equation, the sign of the co-efficient shows the relationship between the dependent and the independent variable.
If the sign of the coefficient is positive, it means that there is a positive relationship between the dependent and the independent variable. In other words, if the value of ‘m’ is positive, then X increases and thus, response variable or dependent variable also increased.
Similarly, if the sign of the coefficient is negative, it means that there is a negative relationship between the dependent and the independent variable. A negative value of ‘m’ implies that if predicator or the independent variable increases then response variable decreases.
Types of Regression
In machine learning, linear and logistic regression analysis are the two most common types of regression analysis techniques used. However, there are other types of regression analysis as well, and their application depends on the nature of data into consideration. Let us look at these types of regression analysis one by one.
Linear Regression:
Linear Regression is a basic form of regression used in machine learning. Linear regression comprises of predictor variable and dependent variable, which are linearly related to each other.
Linear regression is mathematically represented as:

where ‘e’ is the error in the model. The error is defined as the difference between the observed & the predicted value.

In linear regression, the value of m and c is selected in a way that there is less scope of predictor error. It is important to note that the linear regression model is prone to outliers, and one should be careful not to use linear regression in case the size of the data is enormous.
Logistic Regression:
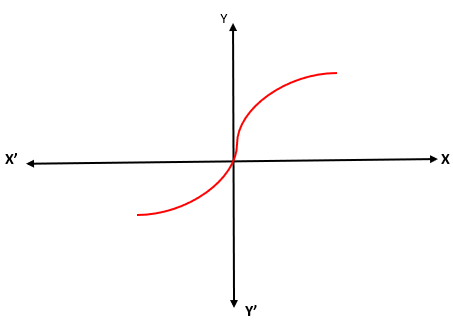
Logistic regression is used when data is discrete. By discrete, we mean that the data is either 0, 1, true or false. Logistic regression is applied in such cases where we have only two values. It represents a sigmoid curve which tells the relationship between the dependent and independent variable.

In the case of logistic regression, it is essential to note that data, in this case, should be extensive, which almost equal chances of values to come in target variable. Also, there should be no multicollinearity between the dependent and the independent variables.
Ridge Regression:
Ridge Regression is used when the correlation between independent variables is high. The reason is that for multi-collinear data, we get unbiased values from least square estimates.
But in the case of multi co-linearity, there could be some bias value. Thus, in case of ridge regression, we introduce a bias matrix. It is a powerful regression method where the model is less prone to overfitting.
Mathematically, it is represented as:

Lasso Regression:
Lasso Regression is amongst the type of regression in machine learning that performs regularization and feature selection. It does not allow the absolute size of the regression coefficient. Thus, it results in the coefficient value to get nearer to zero, which does not possible using Ridge Regression.
In Lasso regression, the features that are required is used and remaining are made zero. Thus, the chances of overfitting get eliminated. In case, the independent variables are highly co-linear, the n lasso regression picks one variable, and the other variable shrinks to zero.
Polynomial Regression:
Polynomial regression is a type of regression analysis technique which is similar to multiple linear regression with little changes. In this technique, the relationship between the dependent and independent variable is denoted by an n-th degree.
In polynomial regression, one fits a polynomial equation on the data using a curvilinear relationship between the independent and dependent variables.

θ0 is the bias or constant
θ1, θ2, θ3… θn are the weights in the equation
N is the degree of polynomial
Bayesian Linear Regression:
Bayesian Linear Regression uses the Bayes theorem to find the value of regression coefficient. In this technique, the posterior distribution of the features is determined instead of finding the least squares.
Bayesian Linear Regression is similar to linear regression and ridge regression, however, it is much simpler than Simple linear regression.