Dundas Minerals Ltd. (ASX: DUN)
DUN is engaged in the exploration of gold, nickel, and copper. It operates the Dundas project and the Triton project in Western Australia.
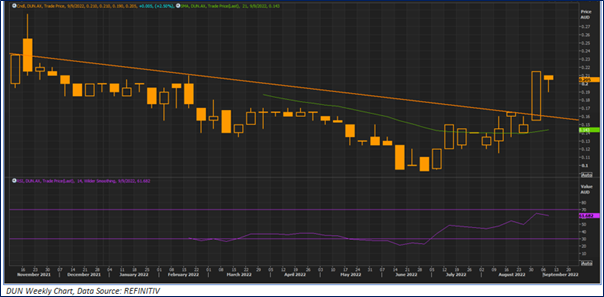
Technical Analysis: On a weekly chart, DUN prices broke a downward sloping trend line by an upside and the prices are sustaining above the breakout level from past two weeks. Also, prices are also trading above its 21-period SMA that is supporting our bullish recommendation. Moreover, the momentum oscillator RSI (14-period) is trading at ~61.68, indicating positive for stock price. An important support level for the stock, is placed at AUD 0.180 while the key resistance level is placed at AUD 0.235.
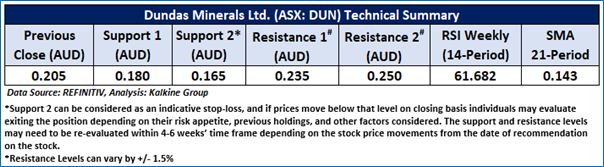

Considering the company’s current price levels sustaining above an upward sloping trend line, momentum oscillator analysis, it is prudent to recommend a ‘Speculative Buy’ rating on this stock. The stock was analysed as per the closing price of AUD 0.205 per share on 6th September 2022, up ~2.50%.
Markets are trading in a highly volatile zone currently due to certain macro-economic and geopolitical tensions prevailing. Therefore, it is prudent to follow a cautious approach while investing.
Weekly Technical Chart – DUN
Halo Technologies Holdings Ltd. (ASX: HAL)
HAL is a fintech company that offers global equity research and investment technology products. The investment platform offering of the company has been divided into HALO Global and HALO Trading.
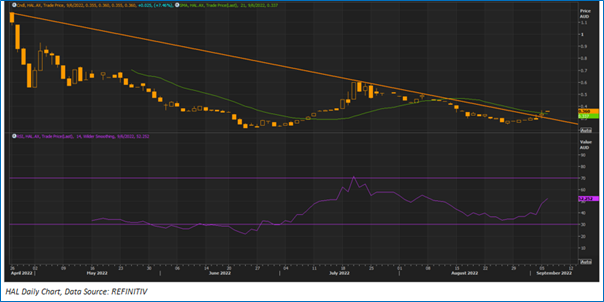
Technical Analysis: On a daily chart, HAL prices broke a downward sloping trend line by an upside and the prices are sustaining above the same from past two days. Also, the prices are sustaining above its 21-period SMA. Moreover, the momentum oscillator RSI (14-period) is trading at ~52.25, indicating strong momentum for the stock. An important support level for the stock, is placed at AUD 0.315 while the key resistance level is placed at AUD 0.415.
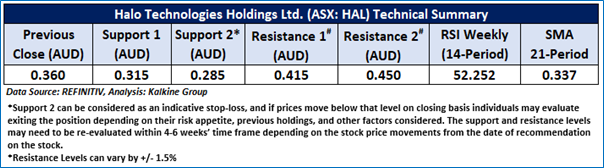

Considering the company’s current price levels broke a downward sloping trend line, momentum oscillator analysis, it is prudent to recommend a ‘Speculative Buy’ rating on this stock. The stock was analysed as per the closing price of AUD 0.360 per share on 6th September 2022, up ~7.46%.
Markets are trading in a highly volatile zone currently due to certain macro-economic and geopolitical tensions prevailing. Therefore, it is prudent to follow a cautious approach while investing.
Daily Technical Chart – HAL
Australia and New Zealand Banking Group Limited (ASX: ANZ)
Australia and New Zealand Banking Group Limited (ASX: ANZ) provide a variety of banking and financial products and services. The bank offers consumer, business, institutional banking, and wealth management services. The current market capitalization as of 06 September 2022 stood at AUD 67.66bn, trading at a stock price of AUD 22.59 per share.
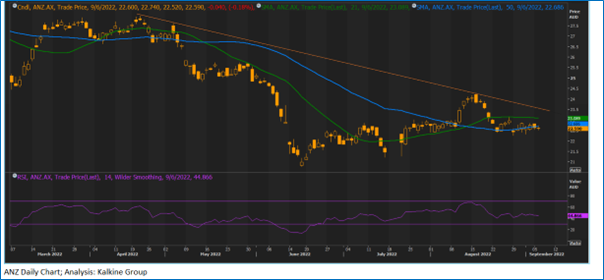
Technical Analysis: On the daily chart, ANZ stock is facing resistance at the downward sloping trendline, indicating the possibility of a downside correction. Moreover, RSI (14-period) is below the mid-point and showing a reading of 44.866 and supports a downside correction. Further, prices are still sustaining below the trend-following indicators 21-period & SMA 50-period SMA, which may act as a resistance level for the stock. An important support level for the stock is placed at AUD 20 while the key resistance level is placed at AUD 25.
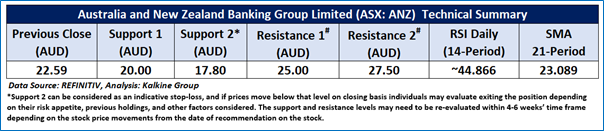
Investors can evaluate the stock based on the support and resistance levels provided in the report in case of keen interest taking into consideration the risk-reward scenario.
Considering the company’s current price levels broke a rising trend line by downside, momentum oscillator analysis, a ‘Watch’ recommendation is given on the stock. The stock was analysed as per the closing price of AUD 22.59 per share, as on 06 September 2022, down by ~0.176%.
Daily Technical Chart – ANZ
4DS Memory Limited (ASX: 4DS)
4DS Memory Limited (ASX: 4DS) is a semiconductor company developing interface switching resistive random-access memory (ReRAM) for gigabyte storage class memory. It conducts its R&D located in Fremont in Silicon Valley, the United States. It has a market capitalization of AUD 44.39 million as of 06 September 2022.
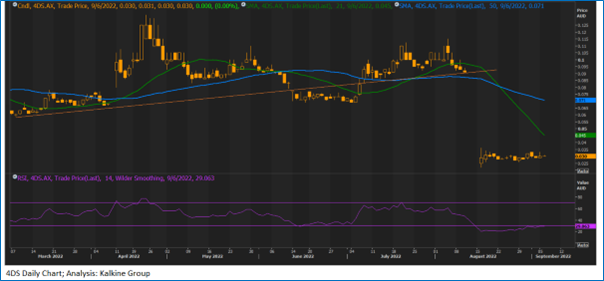
Technical Analysis: On the daily chart, 4DS prices have broken the rising trendline by downside, since then the prices are consolidating in the narrow range. Moreover, the momentum oscillator RSI (14-period) is placed in oversold territory and showing a reading of ~29.063. Further, the prices are trading below the trend-following indicator 21-period SMA and 50-period SMA, which may act as a resistance level. An important support level for the stock is placed at AUD 0.026 while the key resistance level is placed at AUD 0.034.
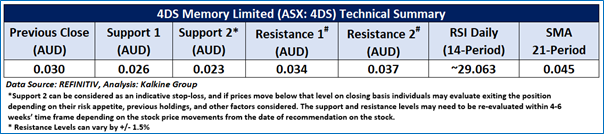
Investors can evaluate the stock based on the support and resistance levels provided in the report in case of keen interest taking into consideration the risk-reward scenario.
Considering the company's current price levels moving in an uptrend, and momentum indicator analysis, a 'Watch' recommendation has been given on the stock. The stock was analysed as per the closing price of AUD 0.030 per share, as of 06 September 2022.
Daily Technical Chart – 4DS
Note 1: Past performance is not a reliable indicator of future performance.
Note 2: Investment decision should be made depending on an individual’s appetite for upside potential, risks, and any previous holdings. This recommendation is purely based on technical analysis, and fundamental analysis has not been considered in this report.
Note 3: Related Risks: This report may be looked at from high-risk perspective and recommendations are provided are for a short duration. Recommendations provided in this report are solely based on technical parameters, and the fundamental performance of the stocks has not been considered in the decision-making process. Other factors which could impact the stock prices include market risks, regulatory risks, interest rates risks, currency risks, social and political instability risks etc.
Technical Indicators Defined: -
Support: A level at which the stock prices tend to find support if they are falling, and a downtrend may take a pause backed by demand or buying interest. Support 1 refers to the nearby support level for the stock and if the price breaches the level, then Support 2 may act as the crucial support level for the stock.
Resistance: A level at which the stock prices tend to find resistance when they are rising, and an uptrend may take a pause due to profit booking or selling interest. Resistance 1 refers to the nearby resistance level for the stock and if the price surpasses the level, then Resistance 2 may act as the crucial resistance level for the stock.
Stop-loss: It is a level to protect further losses in case of unfavourable movement in the stock prices.
The Green colour line reflects the 21-period moving average. SMA helps to identify existing price trends. If the prices are trading above the 21-period, prices are currently in a bullish trend (Vice – Versa).
The Blue colour line reflects the 50-period moving average. SMA helps to identify existing price trends. If the prices are trading above the 50-period, prices are currently in a bullish trend (Vice – Versa).
The Orange colour line represents the Trendline.
The Purple colour line in the chart’s lower segment reflects the Relative Strength Index (14-Period), which indicates price momentum and signals momentum in trend. A reading of 70 or above suggests overbought status, while a reading of 30 or below suggests an oversold status.
Disclaimer
This report has been issued by Kalkine Pty Limited (ABN 34 154 808 312) (Australian financial services licence number 425376) (“Kalkine”) and prepared by Kalkine and its related bodies corporate authorised to provide general financial product advice. Kalkine.com.au and associated pages are published by Kalkine.
Any advice provided in this report is general advice only and does not take into account your objectives, financial situation or needs. You should therefore consider whether the advice is appropriate to your objectives, financial situation and needs before acting upon it.
There may be a Product Disclosure Statement, Information Statement or other offer document for the securities or other financial products referred to in Kalkine reports. You should obtain a copy of the relevant Product Disclosure Statement, Information Statement or offer document and consider the statement or document before making any decision about whether to acquire the security or product.
You should also seek advice from a financial adviser, stockbroker or other professional (including taxation and legal advice) as necessary before acting on any advice in this report or on the Kalkine website. Not all investments are appropriate for all people.
The information in this report and on the Kalkine website has been prepared from a wide variety of sources, which Kalkine, to the best of its knowledge and belief, considers accurate. Kalkine has made every effort to ensure the reliability of information contained in its reports, newsletters and websites. All information represents our views at the date of publication and may change without notice.
Kalkine does not guarantee the performance of, or returns on, any investment. To the extent permitted by law, Kalkine excludes all liability for any loss or damage arising from the use of this report, the Kalkine website and any information published on the Kalkine website (including any indirect or consequential loss, any data loss or data corruption). If the law prohibits this exclusion, Kalkine hereby limits its liability, to the extent permitted by law, to the resupply of services.
Please also read our Terms & Conditions and Financial Services Guide for further information.
On the date of publishing this report (referred to on the Kalkine website), employees and/or associates of Kalkine and its related entities do not hold interests in any of the securities or other financial products covered on the Kalkine website unless those persons comply with certain safeguards, procedures, and disclosures.
Kalkine Media Pty Ltd, an affiliate of Kalkine Pty Ltd, may have received, or be entitled to receive, financial consideration in connection with providing information about certain entity(s) covered on its website.