Company Overview: Dacian Gold Limited is a gold exploration and development company. The Company's principal activities include mineral exploration and development activities at its Mt Morgans Gold Project (MMGP) in Western Australia. MMGP is located over 20 kilometers west of Laverton, being approximately 850 kilometers northeast of Perth in Western Australia. The project area is a 520 square kilometer contiguous tenement package comprising granted mining licenses. MMGP includes various deposits, such as Westralia Deposit, Allanson Deposit, Beresford Deposit and Jupiter Deposit. The Jupiter Deposit occurs in the eastern half of the MMGP, being over 20 kilometers east-south-east of the Westralia Deposit. The Beresford mineralization is located at the south end of the Westralia ore system. The Cameron Well Prospect is located over five kilometers east of Westralia. The Callisto Prospect lies over six kilometers south of the Jupiter Deposit and over seven kilometers west of the Wallaby gold deposit.
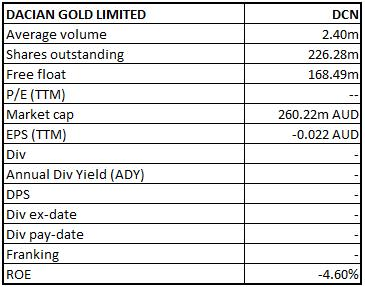
DCN Details
MMGO Production for FY20 estimated between 150,000-170,000oz: Dacian Gold Limited (ASX: DCN) is involved in the mineral exploration and development at its 100% owned Mt Morgans Gold Operation (MMGO). Mt Morgans is one of the largest new gold mines to come on stream in Australia over the last ten years with an ore reserve of 1.4Moz, a mineral resource of 3.5Moz (including Ore Reserves) and highly prospective exploration tenure. Looking at the historical performance over FY15 to FY18, total revenue of the company has grown with a compound annual growth rate (CAGR) of 68.69%. DCN reduced its losses from $8.05 Mn in FY15 to $5.40 Mn in FY18. Analysing the latest operational update for July 2019, the key operational benchmarks improved as compared to June quarter with total ore movement rates across both, the underground and open pit stabilising at planned levels in July. The total mined ore grade at the Westralia underground increased to 3.5g/t, as compared to 2.5g/t in the June quarter as underground productivities across Beresford South, Beresford North and Allanson met expectations. The Company forecasts production for FY2020 of 150,000-170,000oz at an MMGO All-in-Cost (AIC) of A$1,400-$1,500/oz.
Going forward, the company expects an average annual production of 170,000 oz at an All-In Cost of A$1,340 - A$1,440/oz (inclusive of all capital) for the next 5 years, underpinning a 1 million plus ounce Life of Mine (LOM) plan for Mt Morgans Gold Operation. The Management anticipates that there is a strong potential to increase mine life through resource conversion and existing discoveries.
.png)
MMGO Key Operational Guidance (Source: Company Reports)
June’19 Quarter Key Highlights: Gold Production of 36,658 ounces was reported at the Mt Morgans Gold Operations (MMGO) at 97% recovery, which was well within the updated production guidance of 36,000-38,000 oz. The production performance was primarily impacted by not meeting scheduled mine plan in June quarter. MMGO AISC (All-In Sustaining Cost) for the period was reported at A$1,519/oz, which was within the updated guidance of A$1,500- $1,600/oz. The total reconciled contained gold mined during the quarter was over 42,000 oz. The principal cause for the lower quantity of contained gold mined was due to approximately 11,000 oz from both the underground and the open pit that was scheduled to be mined, but due to timing issues, was not mined during the quarter and is scheduled to be mined in the September quarter. Milling performance was negatively impacted during the quarter due to the ball mill motor which failed on 1 June 2019, resulting in, an unplanned 3-day shutdown of the processing plant. Despite the disappointing June quarter, the current grade control model to mill reconciled production across all mines since the processing of ores commenced remains high at 98%.
Under the Life of Mine (LOM) plan update, 8-year LOM delivers annual production of 170,000oz over first 5 years at an MMGO All-In Cost of A$1,340-A$1,440/oz. The total gold production was reported at 1.1Moz at a consolidated All-In Cost of A$1,280 – A$1,380/oz.
In exploration update, new high-grade gold discovered in the north of Westralia below the historic Morgans North pit. The intercepts include 1.7m@ 127g/t, 14.3m @ 12.7g/t, 31m @ 6.3g/t and 3.2m @ 12.5g/t are some of the thickest and highest-grade gold mineralisation intersected at Westralia.
.png)
MMGO Key Operation Metrics for June Quarter (Source: Company Reports)
Decent Cash Position of $45.6 Mn on June 30, 2019: The company, at the end of the period, witnessed a cash and cash equivalents of A$45.6 million with $35.5 million in cash and $10.1 million in unsold gold, as compared to A$70.2 million at the end of the March quarter. The total debt was reported at A$105.5 million, following a repayment of A$18 million during the quarter. The company’s FY2020 debt repayment obligations stand at A$33.3 million. Gold sales for the quarter totalled 35,685 ounces at an average sale price of $1,764/oz for total revenue of $62.9 million. Gold-on-hand at the end of the quarter was 5,026 ounces. At the end of the June quarter, the Company implemented additional hedging commitments of 24,000oz at A$2,019/oz for 1HFY2020. Total hedge commitments over the next two years now total 147,449oz at A$1,810/oz through to end of FY2021. The company’s Total Recordable Injury Frequency Rate (TRIFR) at the end of the June quarter was reported at 14.6.
.png)
June’19 Quarter Operating Cash Flow Statement (Source: Company Reports)
H1FY19 Key Highlights: The net loss after income tax for the half-year was reported at $7,003,629 as compared to $8,821,853 in the previous corresponding period. The result can be attributed to exploration and evaluation costs of $5,681,422, as compared to $6,665,889 in the previous corresponding period. Revenue from the sale of gold during the period has been treated as pre-production income and has been credited to capitalised mine development costs. At the end of the half-year the Group had $67,622,263 in cash and $18,000,229 in unsold gold on hand. During the period, MMGO made debt repayments totalling $16,500,000. The total debt position on December 31, 2018 was reported at $133,500,000 with $123,500,000 drawn from the MMGO project debt facility and $10,000,000 drawn under the Dacian Gold Limited working capital facility.
.png)
H1FY19 Income Statement (Source: Company Reports)
FY18 Key Highlights: Revenue at $1.44 Mn in FY18, witnessed a strong growth of 75.46% on FY17. Net loss for the period declined to $5,402,182 from $18,857,914 in the previous year. The results were owed to exploration and evaluation costs at $27,444,013, offset by an income tax benefit of $27,473,135, as compared to exploration and evaluation expense of $14,957,356 in the previous year. At the end of FY18, the Group had $62,866,140 in cash and had drawn $150 million under the syndicated debt facility, as compared to cash balance of $90,163,337 in FY17. During the period, the Group achieved its first gold production milestone at its planned +200,000 ozpa MMGO, located near Laverton in Western Australia. The operation comprised a 2.5 Mtpa CIL treatment plant, the Westralia underground and the Jupiter open pit mining areas. The mine produced 34,155 ounces in the June Quarter, in-line with the stated guidance of 30K-40K ounces, and in-line with key performance benchmark expectations. MMGO remains on course to complete its ramp-up and achieve its commercial production milestone during the financial year 2019.
.png)
FY2018 Income Statement (Source: Company Reports)
Top 10 Shareholders: The top 10 shareholders have been highlighted in the table, which together form around 51.57% of the total shareholding. AustralianSuper and Perennial Value Management Ltd. hold maximum interest in the company at 8.75% and 6.27%, respectively.
.png)
Top 10 Shareholders (Source: Thomson Reuters)
A Quick Look at Key Metrics: Its current ratio for H1FY19 stood at 0.98x, better than the result in H2FY18 at 0.62x, which implies that the company has improved on its liquidity position. Debt to equity ratio for H1FY19 at 0.86x was lower than 1.25x in H2FY18. Its cash cycle for H1FY19 stood at negative 52.4 days, as compared to the industry median of 42.2 days, which shows the company’s efficiency of asset-liability management.
.png)
Key Metrics (Source: Thomson Reuters)
Key Risks: The company is vulnerable to specific risks such as credit risk arising out of Gold Bullion Sales, trade and other receivables; liquidity risks arising out of wrong forecast estimation; market risks arising out of fluctuation in commodity prices and interest rates; and impairment losses possibilities.
What to expect: The Management is of the view that there is an excellent opportunity to grow the forecast production base through conversion of existing resources not used in the LOM, drilling out recently announced discoveries at Morgans North, Basin Margin and elsewhere throughout the highly prospective project area, which for the most part remains under-explored.
FY20 production has been estimated at 150,000-170,000oz at an MMGO All-in-Cost of A$1,400-A$1,500/oz. The Company anticipates a continued focus on accelerating planned development rates at Westralia during the H1FY2020. This effort will position the company favourably from the beginning of H2FY2020. In this regard, the company expects total production at Mt Morgans will be weighted around 45%/55% between the first half and the second half of FY2020. The consolidated All-in-Cost guidance has been estimated at A$1,450-A$1,550/oz for FY2020 which is inclusive of all forecasted capital spend at MMGO and includes budgeted spend for corporate and exploration expenditure.
The updated mine plan confirms that the MMGO is a significant gold production centre with strong operating cash flows forecast for at least the next 8-years. The Company is forecasting over one million ounces of gold production with the first 5 years averaging 170,000 ounces per annum.
Given that Mt Morgans is centred over the highly prospective Mt Margaret anticline within the prolific Laverton goldfields, the company is confident that there is an excellent potential to increase the mine plan well beyond the current 8-year life through ongoing exploration success.
MMGO provides strong cash flow generation over the next 8 years Life of Mine. Average group annual cash flow over first 5 years (FY2020-FY2024) has been estimated at A$90M at A$2,000/oz, and then will increase to average annual cash flow of A$118M at A$2,200/oz. Group’s cumulative cash flow over the first 5 years (FY2020-FY2024) has been estimated at A$452 Mn at A$2,000/oz, which will increase to A$591 Mn at A$2,200/oz annually. Group’s cumulative cash flow over Life of Mine (FY2020-FY2027) has been estimated at A$627M at A$2,000/oz, which will increase to A$810M at A$2,200/oz annually.
.png)
Group’s Consolidated Cash Flow Estimation Over Next 8 Years (Source: Company Reports)
Gold Outlook: At the time of writing, Gold Spot (XAU/USD) traded at US$1,524.36 (September 3, 2019, 14:53 (UTC+10)), and presently is at an important resistance zone of US$1543-US$1563. Considering any escalation in the ongoing trade war between the USA and China, may break this zone, leading to a fresh upside rally.
.png)
Key Valuation Metrics (Source: Thomson Reuters)
Valuation Methodology: Price to Earnings based Valuation
.png)
Price to Earnings based Valuation (Source: Thomson Reuters), *NTM: Next Twelve Months
Note: All forecasted figures and peers have been taken from Thomson Reuters, *NTM-Next Twelve Months
Stock Recommendation: The company’s stock witnessed a rise of 20.42% in the span of one-month and a whopping return of 123.30% in three-months. On June 7, 2019, the stock made its 52-week low of $0.375, and since then it is on an uptrend and is moving towards the average of its 52-week high and low levels, which is expected to attract the attention of the market players and, therefore, proffers a decent opportunity for accumulation. Present ongoing development at Mt Morgans Gold operation (MMGO), FY20 production guidance and decent Gold outlook are expected to help the company to deliver a sustainable return for its customers and shareholders. Looking at the business prospects over the long-term, we have valued the stock using a relative valuation method, Price to Earnings (PE) multiple, and have arrived at a target price upside of lower double-digit growth (in %). Hence, considering the aforesaid facts and current trading levels, we give a “Buy” recommendation on the stock at the current market price of A$1.220 per share, up 6.087% on 3 September 2019.
 (002).jpg)
DCN Daily Technical Chart (Thomson Reuters)
Disclaimer
The advice given by Kalkine Pty Ltd and provided on this website is general information only and it does not take into account your investment objectives, financial situation or needs. You should therefore consider whether the advice is appropriate to your investment objectives, financial situation and needs before acting upon it. You should seek advice from a financial adviser, stockbroker or other professional (including taxation and legal advice) as necessary before acting on any advice. Not all investments are appropriate for all people. Kalkine.com.au and associated pages are published by Kalkine Pty Ltd ABN 34 154 808 312 (Australian Financial Services License Number 425376). The information on this website has been prepared from a wide variety of sources, which Kalkine Pty Ltd, to the best of its knowledge and belief, considers accurate. You should make your own enquiries about any investments and we strongly suggest you seek advice before acting upon any recommendation. Kalkine Pty Ltd has made every effort to ensure the reliability of information contained in its newsletters and websites. All information represents our views at the date of publication and may change without notice. To the extent permitted by law, Kalkine Pty Ltd excludes all liability for any loss or damage arising from the use of this website and any information published (including any indirect or consequential loss, any data loss or data corruption). If the law prohibits this exclusion, Kalkine Pty Ltd hereby limits its liability, to the extent permitted by law to the resupply of services. There may be a product disclosure statement or other offer document for the securities and financial products we write about in Kalkine Reports. You should obtain a copy of the product disclosure statement or offer document before making any decision about whether to acquire the security or product. The link to our Terms & Conditions has been provided please go through them and also have a read of the Financial Services Guide. On the date of publishing this report (mentioned on the website), employees and/or associates of Kalkine Pty Ltd do not hold positions in any of the stocks covered on the website. These stocks can change any time and readers of the reports should not consider these stocks as personalised advice.