Australian Foundation Investment Company Limited
A Brief About AFI: Australian Foundation Investment Company Limited (ASX: AFI) aims at providing shareholders with attractive investment returns through access to a growing stream of fully franked dividends and enhancement of capital invested.The company is possessing diversified portfolio which is mainly of ASX-listed companies and it is having professional management and an experienced board, investment and management team.
Portfolio Facts:The size of the portfolio as on 28 Feb 2019 is $7.2 billion. The overall portfolio is largely concentrated with the top 10 holdings, which represents 47.7% of the total portfolio. More precisely, the top 5 companies constitute 31.1% of the total portfolio. The portfolio is diversified across the sectors, while highly exposed to Banks (22%), Materials (18.1%), Industrials (14.9%), other Financials (10.3%) and Healthcare (10.1%).
.png)
NTA & Top 25 Investments as on 28 February 2019, (Source: company Reports)
On the financial front,AFI recorded a profit of $279 million in FY18, up 13.7% on the YoY basis. The company’s investment income increased $31.5 million (i.e. 11.6%) primarily due to a lift in dividends across a range of the companies, particularly resource companies, including participation in the Rio Tinto off-market buy-back. The company’s EPS for FY18 stood at 23.6 cents reflecting a rise from 21.3 cents in FY17. The final dividend was maintained at 14 cents per share fully franked, bringing total dividends for the year to 24 cents per share fully franked, same as the last year.
Profit for H1 FY19 was at $239.8 million, up 75.4% from $136.7 million in the corresponding period last year. The interim dividend of 10 cents per share fully franked has been maintained and a special dividend of 8 cents per share (fully franked) had also been declared.
Moreover,AFIC will remain focused at sound business and will continue to look at the opportunities to add companies with sustainable competitive advantage, sound balance sheet and importantly, strong management that can deliver long term benefits to shareholders.However, we cannot ignore concentration risk of the portfolio.
Stock Recommendation: AFIC’s portfolio was down 6.4% for H1 FY19 as compared to S&P/ASX 200 which fell 6.2% over the same period.The significant correction in the markets has produced a more conducive environment for long term investing. Looking at its investment style and portfolio composition (higher exposure to banks i.e. 22%), any significant changes in policy will hit the performance. In the span of previous six months, the company’s stock has posted -4.44% return. The stock is trading close to a 52-week lower level with PE multiple of 18.24x which is higher than the industry median of 12.0x. Hence, we give an “Expensive” recommendation on the stock at the current market price of $5.870 per share (up 0.171% on 28 March 2019), assuming that all catalyst have been discounted at the current level.
Cadence Capital Limited
Decent Portfolio Performance in February Month: Cadence Capital Limited (ASX: CDM) is a long-short Australian listed investment company with a portfolio comprising of publicly traded Australian companies. Recently, the Group posted Net Tangible Assets (NTA) per share before tax of $0.973 as on February 28, 2019 while NTA per share after tax amounted to $1.103, representing a decent rise of 3.4% and 2.0%, respectively as compared with last month.
For the half-year ended December 2018, the company posted negative gross performance of 19.9% as compared to the decrease in All Ordinaries Accumulation Index of 7.3%. For the half-year ended December 2018, net investments were having the value of $203,050,126.
.png)
Top 20 Holdings as at 28 February 2019 (Source: Company Reports)
Financial Performance for FY 2018:CDM recorded a net profit of $ 41.2 million for FY18, up 11.4% as compared to the previous year. The investment portfolio produced an 18.2% gross performance, outperforming the All Ordinaries Accumulation Index by 4.5%. The company declared fully franked dividend at 8 cents, equated to an annualised yield of 6.4%.
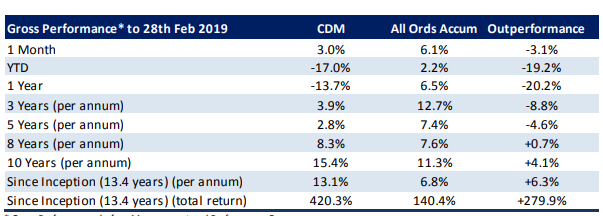
Looking at the H1 FY19 financial performance, CDM recorded losses of $58.1 million and fund gross performance was seen in negative territory (-19.9%), underperforming All Ordinaries Accumulation Index by 12.6%.The company announced fully franked interim dividend of 3.0 cents per share and it will be payable on 13 May 2019 with the record date of April 30, 2019. This equates to a 6.8% annual fully franked yield. For the month of February 2019, the underlying portfolio posted a decent return of 3.0% versus a 6.1% return generated by All Ordinaries Accumulation Index. Long term performance remains decent with the 3 years return at 3.9% while, since inception, CDM has delivered a return of 13.1% pa against the benchmark return of 6.8%.
Investment Update: February 2019 (Source: Company Reports)
Moreover, we see concentration risk to the portfolio being ~32% of the investment made in the Top 5 companies.The portfolio is likely to experience periods of underperformance, given the concentrated nature of the portfolio. The success and profitability of the company depend upon the ability and competence of the manager to invest in well-managed companies and other entities. Meanwhile, the share price of the company has fallen 25.51% in the past six months as at 27 March 2019 and is trading close to a 52-week lower level making it a decent buy opportunity. Hence, considering the decent portfolio performance in February month under volatile global market and looking at current trading level, we give a “Speculative Buy” recommendation on the stock at the current market price of A$0.900 per share (down 0.552% on March 28, 2019).
Disclaimer
The advice given by Kalkine Pty Ltd and provided on this website is general information only and it does not take into account your investment objectives, financial situation or needs. You should therefore consider whether the advice is appropriate to your investment objectives, financial situation and needs before acting upon it. You should seek advice from a financial adviser, stockbroker or other professional (including taxation and legal advice) as necessary before acting on any advice. Not all investments are appropriate for all people. Kalkine.com.au and associated pages are published by Kalkine Pty Ltd ABN 34 154 808 312 (Australian Financial Services License Number 425376). The information on this website has been prepared from a wide variety of sources, which Kalkine Pty Ltd, to the best of its knowledge and belief, considers accurate. You should make your own enquiries about any investments and we strongly suggest you seek advice before acting upon any recommendation. Kalkine Pty Ltd has made every effort to ensure the reliability of information contained in its newsletters and websites. All information represents our views at the date of publication and may change without notice. To the extent permitted by law, Kalkine Pty Ltd excludes all liability for any loss or damage arising from the use of this website and any information published (including any indirect or consequential loss, any data loss or data corruption). If the law prohibits this exclusion, Kalkine Pty Ltd hereby limits its liability, to the extent permitted by law to the resupply of services. There may be a product disclosure statement or other offer document for the securities and financial products we write about in Kalkine Reports. You should obtain a copy of the product disclosure statement or offer document before making any decision about whether to acquire the security or product. The link to our Terms & Conditions has been provided please go through them and also have a read of the Financial Services Guide. On the date of publishing this report (mentioned on the website), employees and/or associates of Kalkine Pty Ltd do not hold positions in any of the stocks covered on the website. These stocks can change any time and readers of the reports should not consider these stocks as advice or recommendations.