Company Overview - Kathmandu Holdings Limited (interchangeably referred to as ‘KMD’) is engaged in designing, marketing and retailing of clothing and equipment for outdoor, travel and adventure. The Company operates in three geographical areas: New Zealand, Australia and the United Kingdom. In apparel its product line includes waterproof jackets, down jackets, thermals, fleece jackets, shirts and pants, merino apparel and thermals, and footwear and socks. Its equipment product line includes packs, bags, sleeping bags, tents, travel accessories and camping accessories. The Company has approximately 70 stores in Australia, 40 in New Zealand and six in United Kingdom. The Company’s subsidiaries include Milford Group Holdings Limited, Kathmandu Limited, Kathmandu Pty Limited and Kathmandu (U.K.) Limited.
Analysis – Kathmandu is a vertically integrated retailer of outdoor and adventure clothing and accessories, predominantly under the 27 year old Kathmandu brand, which enjoys strong recognition across a wide age group. Despite relatively low stock turnover, high gross margins enable a reasonable return on capital. The store rollout is forecast to increase from 140 currently to 180 in fiscal 2018 and should drive strong earnings growth, particularly during the next two years, assuming discretionary retail demand holds up in Australia and New Zealand. However, we believe that low barriers to entry are likely to attract competition in the longer term, with retailers attracted to Kathmandu’s high gross margins.
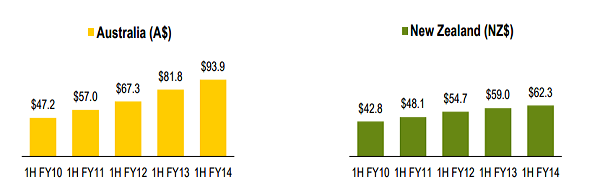 Kathmandu Sales ($Millions) (Source - Company Reports)
Due to colder temperatures in July compared to June across most of Australia and New Zealand, Kathmandu has recovered a significant amount of sales shortfall experienced in the early part of winter. Earnings before interest and tax or EBIT from fiscal 2014 is now expected to be between NZD 62.5 million and NZD 65.5 million compared with NZD 63.4 million for the previous year. Previous guidance was in decrease of between 10% and 15%. Net operating profit after tax or NPAT is expected to be between NZD 39.5 million and NZD 42.5 million compared with NZD 44.2 million for fiscal 2013.
 Same Store Sales Growth (Source - Company Reports)
Kathmandu provides exposure to a clothing and equipment retailing with products designed for adventure travelers and consumers with an outdoor lifestyle. Stores are located predominantly in Australia and New Zealand, however, there is also a small presence in United Kingdom. The company is vertically integrated, i.e., designing, sourcing material, marketing and selling Kathmandu products. After acquiring Kathmandu in 2006, private equity invested heavily in its business platform, including staff, IT infrastructure and distribution capacity, and grew store numbers from 46 stores in fiscal 2006 to 82 stores at the end of fiscal 2009. Kathmandu dual listed in Australia and New Zealand via initial public offering in November 2009 and currently has 140 stores with a long term target of 180 stores.
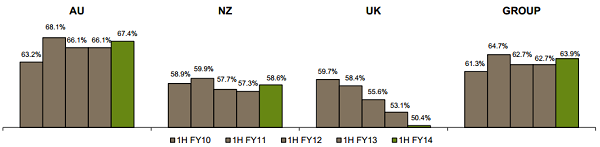 Kathmandu Gross Profit Margin (Source - Company Reports)
Kathmandu sells products at multiple price points enabling it to attract a broad customer base. It does not directly compete with highly technical retailers of specialist equipment for expert mountaineers, nor does it sell low end products for value conscious consumers who shop at general merchandise retailers. According to the management, the company competes in the mainstream/ lifestyle middle ground. The target market is, predominantly constituted by outdoor enthusiasts among young professionals, families with above average incomes and empty nesters. This has been a growing category in recent years, as discretionary consumer dollars have been directed towards aspirational experiences such as outdoor activities and travel.
 EBITDA ($ Millions) (Source - Company Reports)
Sales are not conducted through a wholesale channel enabling the company to achieve both a wholesale and retail margin. Kathmandu generates the majority of annual sales during three key sales events (winter, Christmas and Easter) where the consumer receives discounted product(s), regularly about 50%. Despite the discount, gross margins have remained attractive at more than 60%. The sustainability of this pricing model is questionable in what has become a tough retail climate where discounting has become common.
 Permanent Store Locations (Source - Company Reports)
Kathmandu is in strong financial health with net debt to equity ratio of 18.6% and EBIT/interest coverage of 14.4 times at the end of fiscal 2013. Since the company’s stock exchange listing in 2009, it has not raised additional capital with the store rollout being funded through existing cash flow. This has occurred concurrent with funding a 50% to 60% dividend payout ratio and reducing debt. When the store rollout tapers off as the company approaches its 180 store target we expect gearing metrics to further improve as capital intensity decreases.
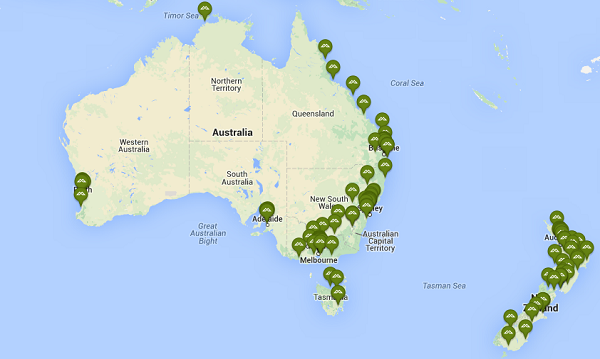 Kathmandu Store Locations Australia + New Zealand (Source - Company Reports)
We view Kathmandu’s capital structure as sustainable with low gearing at 0.6 times net debt/ EBITDA, which is appropriate given the discretionary nature of its revenue streams. The current debt facility is a mix of Australian Dollar and New Zealand Dollar borrowings and expires in December 2015. Capital intensity is moderate because of funding requirements for working capital and capital expenditure for new stores hence the dividend payout ratio target of 50% to 60%.
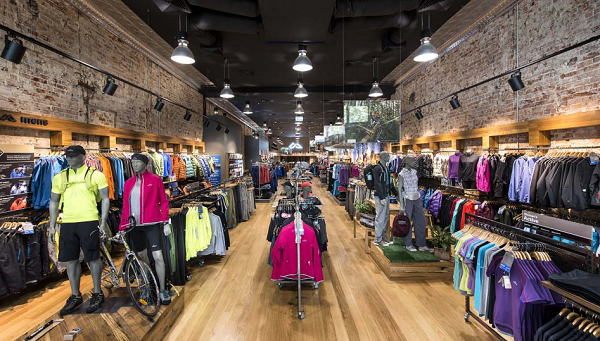 Kathmandu Store (Source - Company Reports)
Kathmandu has a number of positive attributes that set it apart from many other retailers. The company owns its own brand giving it greater ability to respond to customers’ tastes and position its products at the high end. It also means that the brand is exclusive to its retail network, which enables greater pricing flexibility and control. Kathmandu is also a beneficiary of a strongly growing category with participation in outdoor recreational activity and travel growing strongly in Australia at mid-single digit percentage rates. This is reflected in Kathmandu’s like for like sales growth.
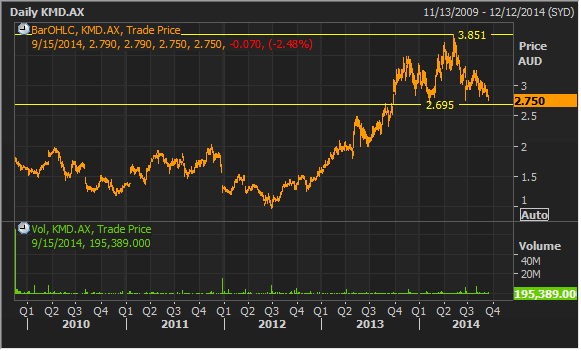 KMD Daily Chart (Source - Thomson Reuters)
Kathmandu’s first half fiscal 2014 result was solid given difficult trading conditions. While headline numbers were weak with sales growth increasing 1.0% and same store sales growth decreasing 3.5%, this was almost entirely driven by currency headwinds resulting from the translation effect of the Australian Dollar Depreciation versus the New Zealand Dollar. Adjusting for currency impact sales increased 10.5% compared with the previous comparable period with the same store sales growth of 5.4%. The gross profit margin was strong at 63.9% at the top end of 62% to 64% target range, which drove an increase in operating margins from 9.5% to 10.5% on the previous comparable period.
We believe KMD’s own strong brand coupled with an integrated business model are key factors that will foster continued healthy top line growth. We expect these elements will continue to underpin KMD’s successful promotional strategy, ability to grow loyal customer base, online growth, as well as create opportunity to enhance KMD’s current store portfolio. We put a BUY recommendation on the stock at the current price of $2.75.
Disclaimer
The advice given by Kalkine Pty Ltd and provided on this website is general information only and it does not take into account your investment objectives, financial situation or needs. You should therefore consider whether the advice is appropriate to your investment objectives, financial situation and needs before acting upon it. You should seek advice from a financial adviser, stockbroker or other professional (including taxation and legal advice) as necessary before acting on any advice. Not all investments are appropriate for all people.Kalkine.com.au and associated pages are published by Kalkine Pty Ltd ABN 34 154 808 312 (Australian Financial Services License Number 425376).The information on this website has been prepared from a wide variety of sources, which Kalkine Pty Ltd, to the best of its knowledge and belief, considers accurate. You should make your own enquiries about any investments and we strongly suggest you seek advice before acting upon any recommendation.Kalkine Pty Ltd has made every effort to ensure the reliability of information contained in its newsletters and websites. All information represents our views at the date of publication and may change without notice. To the extent permitted by law, Kalkine Pty Ltd excludes all liability for any loss or damage arising from the use of this website and any information published (including any indirect or consequential loss, any data loss or data corruption). If the law prohibits this exclusion, Kalkine Pty Ltd hereby limits its liability, to the extent permitted by law to the resupply of services. There may be a product disclosure statement or other offer document for the securities and financial products we write about in Kalkine Reports. You should obtain a copy of the product disclosure statement or offer document before making any decision about whether to acquire the security or product.The link to our Terms & Conditions has been provided please go through them and also have a read of the Financial Services Guide. On the date of publishing this report (mentioned on the website), employees and/or associates of Kalkine Pty Ltd currently hold positions in: BHP, BKY, KCN, PDN, and RIO. These stocks can change any time and readers of the reports should not consider these stocks as advice or recommendations.
Copyright
Copyright © 2014 Kalkine Pty Ltd ABN 34 154 808 312. No part of this website, or its content, may be reproduced in any form without the prior consent of Kalkine Pty Ltd.
Kalkine is a trading name of Kalkine Pty Ltd ABN 34 154 808 312, which holds Australian Financial Services Licence No. 425376.