Quartile
Updated on 2023-08-29T11:58:06.595551Z
What are quartiles?
Quartiles refer to the set of values that divide the dataset into four equal parts. Quartiles are nothing but demarcations at every quarter. They represent the figure at the end of a quarter and the beginning of the next quarter.
Quartiles help find out the median. The second quartile represents the median value. Each dataset can be defined as a number line and can be divided into quarters with the help of three quartiles. These quartiles are Q1, Q2 and Q3, and they can be understood as:
Q1= Comes after the first 25% of the dataset, also known as the lower quartile.
Q2 = Comes after the first 50% of the dataset, also known as the median.
Q3 = Comes after the first 75% of the dataset, also known as the upper quartile.
These three quartiles divide the dataset into four parts:
- Quarter 1: From first value in the dataset till the value lying on 25% of the dataset.
- Quarter 2: From the value after 25% of the dataset to the value lying till 50% of the dataset.
- Quarter 3: From the value after 50% of the dataset to the value till 75% of the dataset.
- Quarter 4: From the value after 75% of the dataset until its last value.
How are quartiles calculated?
Consider the following dataset:

The first step would be to organise the dataset into ascending order. This would give us the following:

The dataset contains 16 values. In the beginning, the number of values must be divided by four to find how many values must be there in each quarter. In the case above, each quarter must have four values. Thus, the dataset can be divided as follows:

The median for an even set of numbers is calculated as:

Therefore, the (n/2)th value refers to the number 14. The value after that is 15. Thus, the median is calculated as: (14+15) / 2 = 14.5.
Now the first quartile would lie in the middle of 3 and 14.5. Therefore, Q1 would be the median of the lower quartile range. The median for the first half of the dataset would be (7+9) / 2 = 8.
Similarly, for the last half of the quartile, the median would be (21+ 22) / 2 = 21.5. Thus, quartiles for this dataset can be summarised as: Q1 = 8; Q2 = 14.5 ; Q3 = 21.5.

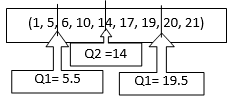
However, the quartile calculation becomes much easier when the number of terms is odd. Consider the following dataset, already arranged in ascending order:

Here, there are nine terms in the dataset, which means that the median of the dataset would be the 5th value. Thus Q2= 14.
Consider the range lying below the median. For this range, the median value would be (5+6)/2 = 5.5. Similarly, for the range lying above the median value, the middle value is (19+20)= 19.5.
Therefore, Q1 = 5.5 ; Q2 = 14 ; Q3 = 19.5.

The interquartile range refers to the value obtained by subtracting Q1 from Q3. Therefore, in the above example, the interquartile range would be 19.5 – 5.5 = 14. Dividing the interquartile range by 2 gives the quartile deviation. Therefore, quartile deviation in the above example = 14/2 = 7.
What is the difference between a Quartile and a Quarter?
The difference between a quarter and a quartile is that a quarter represents a portion (25%) of the dataset while a quartile is a demarcation representing the beginning or ending of a quarter. A quarter is a part extracted from the whole, and it may hold multiple values inside it. However, a quartile is simply one value out of the entire dataset which lies at a particular position.
Consider the same example as mentioned above:

In this dataset, a quarter includes four values, but a quartile is a single value that lies at the beginning of the next quarter and the end of the previous quarter.
What is the formula for quartiles?
For quicker calculation of quartiles, there is a formula that can be applied to any dataset. The formula is as follows:

Where, L1 = Lower limit
L2 = Upper limit
r = number of Quartile
F = Frequency
C= Cumulative frequency of the class before the quartile class.